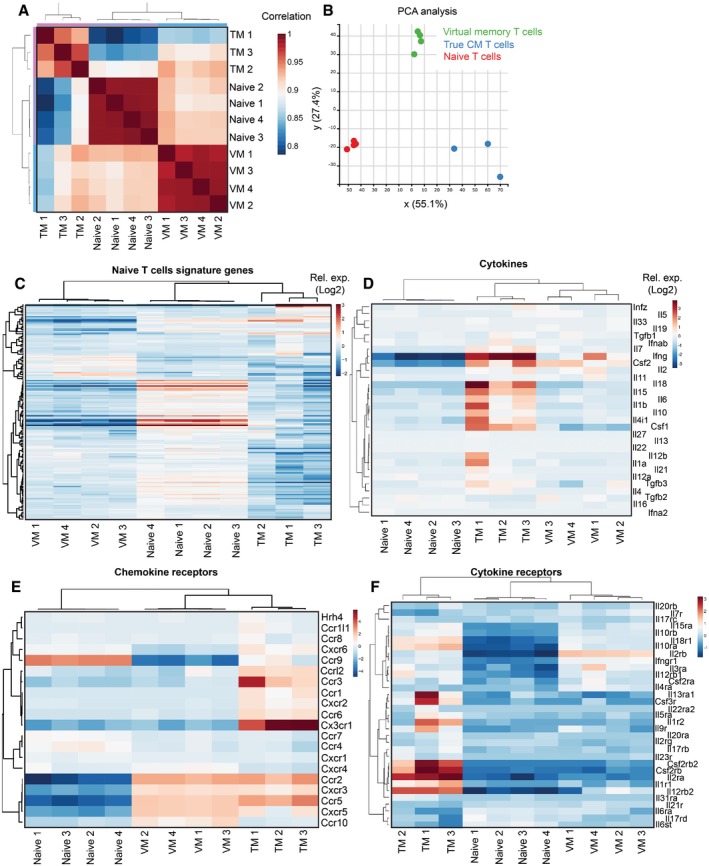
Figure EV4. Gene expression analysis of naïve, VM, and TM T cells, related to Fig 4 .

-
ACorrelation of the gene expression between individual samples.
-
BPCA analysis between the samples.
-
C–FEnrichment of CD8+ naïve signature genes (as revealed by previous studies) (C), cytokine encoding genes (D), chemokine receptor encoding genes (E), and cytokine receptor encoding genes (F) in naïve, VM, and true CM T cells.
