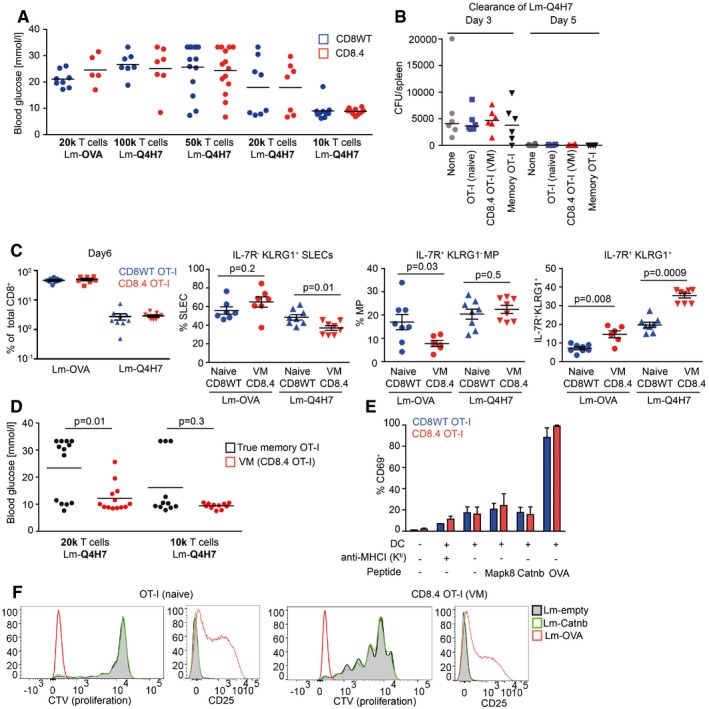
Figure EV5. Functional characterization of naïve, VM, and TM T cells, related to Fig 5 .

- Indicated number of CD8WT OT‐I or CD8.4 OT‐I T cells were adoptively transferred into RIP‐OVA hosts, which were infected with Lm‐OVA or ‐Q4H7 1 day later. Blood glucose was measured 7 days after the infection. n = 5–11 mice per group in 3–6 independent experiments. These are the same experiments as in Fig 5A. Mean is indicated.
- FACS‐sorted 1 × 10⁴ naïve CD8WT OT‐I, CD8.4 OT‐I (VM), sorted true memory OT‐I T cells or no T cells were adoptively transferred into Ly5.1 C57Bl/6 mice followed by infection with 5,000 CFU Lm‐Q4H7. Total Lm‐Q4H7 CFU counts in the spleen were quantified on day 3 and day 5 post‐infection. n = 6 mice in two independent experiments.
- Quantification of the experiment shown in Fig 5E and F. Percentage of donor OT‐I and CD8.4 OT‐I T cells among all CD8+ T cells is shown. Percentage of short‐lived effector cells (IL‐7R− KLRG1+), memory precursors (IL‐7R+ KLRG1−), and double‐positive cells IL‐7R+ KLRG1+ among the donor cells are shown. Statistical significance was calculated using Mann–Whitney test. n = 7 (CD8.4 OT‐I + Lm‐OVA) or 9 (the other three experimental conditions) in four independent experiments.
- Indicated number of CD8.4 OT‐I or true memory OT‐I T cells were adoptively transferred into RIP‐OVA hosts, which were infected with Lm‐Q4H7 1 day later. The glucose in the blood was measured on day 7 post‐infection. Statistical significance was calculated using Mann–Whitney test n = 11 (1 × 10⁴ transferred cells) or 13 (2 × 10⁴ transferred cells) mice per group in four independent experiments. These are the same experiments as in Fig 5H.
- OT‐I or CD8.4 OT‐I was cocultured with bone marrow dendritic cells that were pre‐loaded or not with 10 μM putative endogenous positive selecting peptides for OT‐I T cells (Mapk8, AGYSFEKL; Cantb, RTYTYEKL) or with 0.1 μM OVA peptide. Blocking of the MHCI by adding anti‐H2‐Kb antibody (clone Y3, 10 μg/ml) was used as a negative control. Percentage of CD69+ T cells in the overnight stimulation was quantified by flow cytometry. Mean + SEM. n = 2 (MHC‐I blocking) or 3 (all the other experimental conditions) independent experiments.
- CellTrace violet‐loaded OT‐I or CD8.4 OT‐I T cells were adoptively transferred into Ly5.1 C57Bl/6 donors followed by infection with Lm‐OVA (1 × 10⁴ transferred cells), Lm‐Catnb, or empty Lm (both 1 × 10⁵ transferred cells) 1 day later. Expression of activation marker CD25 and dilution of the proliferation dye in donor cells was examined on day 5 post‐infection. Representative mice out of seven in total from three independent experiments are shown. The cells from the Lm‐OVA infected mice are the same as used for the analysis in Fig 5G.
