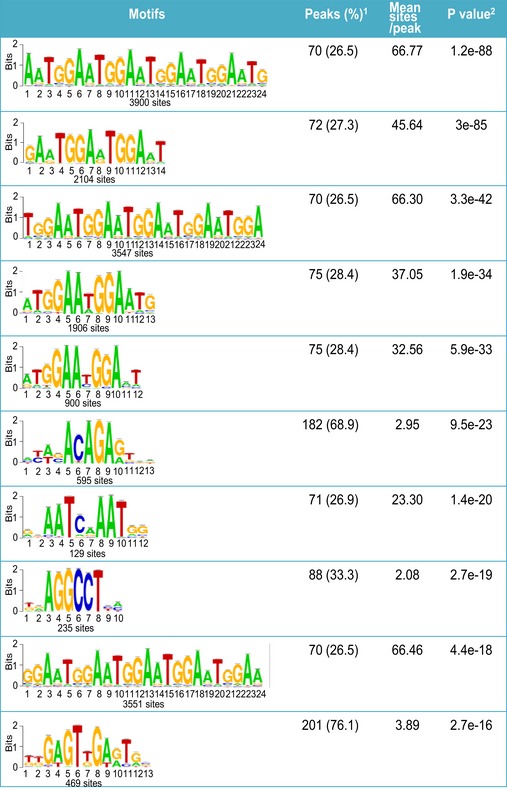
Figure EV2. The top 10 motifs identified from ChIP‐seq.

1Percentage of peaks containing the motif and their average occurrence in the peaks. 2The presence of motifs was ranked by their P‐values that were generated by Fisher's exact test.

1Percentage of peaks containing the motif and their average occurrence in the peaks. 2The presence of motifs was ranked by their P‐values that were generated by Fisher's exact test.