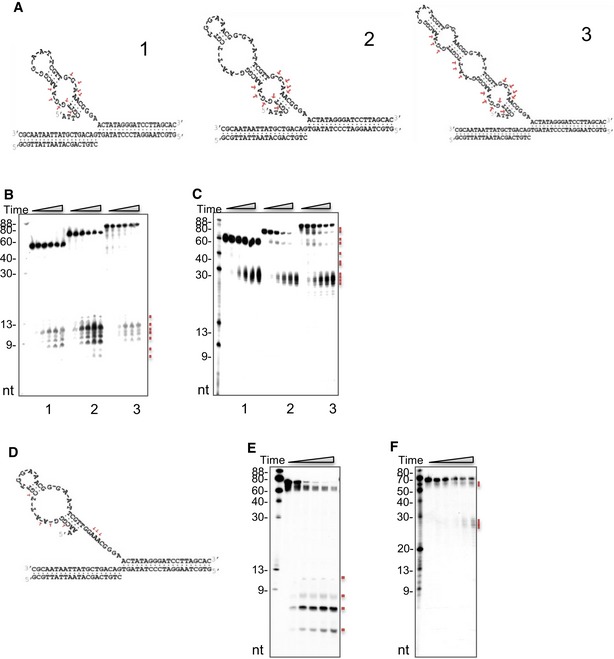
Figure EV3. DNA2 cleaves at the 5′ end of each complementary DNA where the loops are.

-
ASchematic graphs show the predicted structures of each substrate from the RNAfold software package. The cleavage signatures of DNA2 on these substrates are shown by arrows.
-
B, CDNA2 activity on substrates with similar structures as those shown in (A). Three substrates were made from two (substrate 1), three (substrate 2), or four repeats (substrate 3) of the 17‐nt CENP‐B‐boxes to mimic the α‐satellite stem‐loop structure. WT DNA2 (5 ng) was incubated with 1 pmole of (B) 5′‐ or (C) 3′‐radiolabeled substrate for 5, 10, 20, 30, or 40 min. Each small red square marks a cleavage product.
-
D–FAn intermediate DNA product (illustrated in D) was specifically designed to determine if the second loop of substrate 2, shown in panel (A), was preferentially cleaved by DNA2. WT DNA2 (5 ng) was incubated with the (E) 5′‐ or (F) 3′‐radiolabeled substrates for the same amount of time as in panels (B and C) to assess the cleavage.
Source data are available online for this figure.
