-
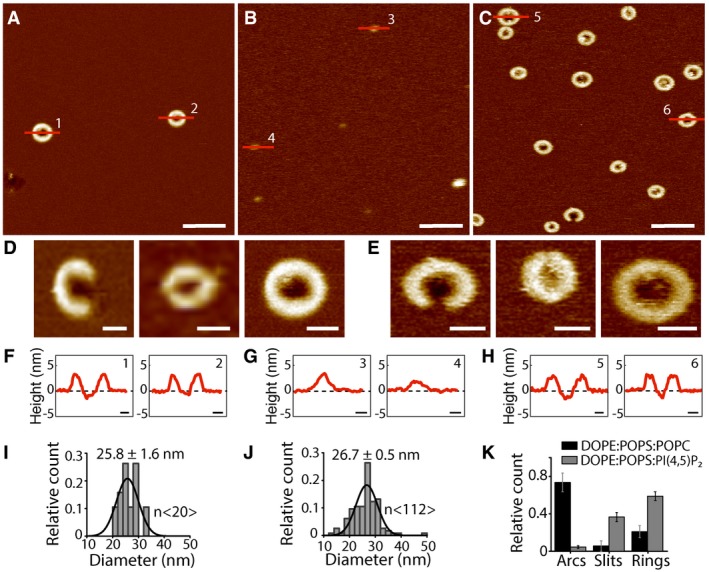
A–C
AFM topographs showing GSDMDNterm oligomers formed on SLMs made from (A) POPS, DOPE, and POPC (35:25:40 molar ratio); (B) POPS, DOPE, and POPI (35:25:40 molar ratio); and (C) POPS, DOPE, and PI(4,5)P2 (35:25:40 molar ratio).
-
D, E
Topographs showing arc‐, slit‐, and ring‐like GSDMDNterm oligomers formed on SLMs assembled from (D) POPS, DOPE, and POPC (35:25:40 molar ratio) and (E) POPS, DOPE, and PI(4,5)P2 (35:25:40 molar ratio).
-
F–H
Height profiles of GSDMDNterm oligomers measured along the red lines indicated in the topographs (A–C). Black dashed lines indicate the SLM surface (0 nm height).
-
I–J
Diameter of GSDMDNterm ring‐shaped oligomers formed on SLMs made from (I) POPS, DOPE, and POPC and (J) POPS, DOPE, and PI(4,5)P2. Black lines are Gaussian fits determining the mean ± SE values given for each distribution.
-
K
Number of arc‐, slit‐, and ring‐shaped GSDMDNterm oligomers formed on SLMs made from POPS, DOPE, and POPC (black bars) or POPS, DOPE, and PI(4,5)P2 (gray bars). Bars present averages and error bars SD.
Data information: The full color range of the topographs corresponds to a vertical scale of 12 nm. Scale bars, 100 nm (A–C), 20 nm (D, E), and 10 nm (F–H). Averages and errors are given in the text and summarized in
.