
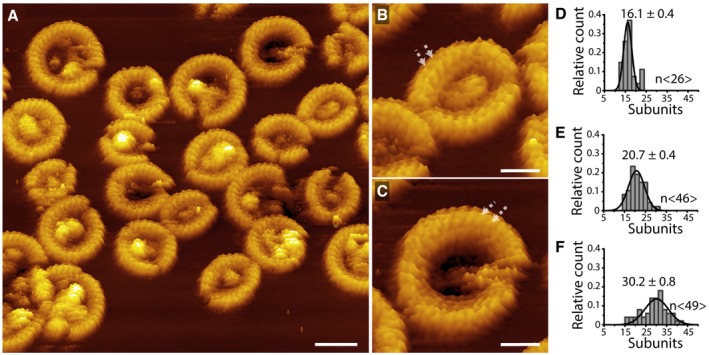
Figure 5. Arc‐, slit‐, and ring‐shaped GSDMDN term oligomers imaged at sub‐nanometer resolution.
-
AHigh‐resolution AFM topograph of GSDMDNterm oligomers assembled on SLMs made from POPC, DOPG, DOPS, DOPE, and CL (40:20:10:20:10 molar ratio). After SLMs have been incubated with GSDMD and caspase‐1 for 60 min at 37°C, FD‐based AFM topograph was recorded in buffer solution at room temperature (Materials and Methods).
-
B, CGSDMDNterm oligomers shown at higher magnification. Arrows indicate adjacent subunits of oligomers, which show an average distance of 2.3 ± 0.3 nm (mean ± SD, n = 117).
-
D–FAverage number of subunits per (D) arc‐, (E) slit‐, and (F) ring‐shaped GSDMDNterm oligomer. Black lines are Gaussian fits used to determine mean ± SE of the data, and n indicates the number of oligomers measured.