
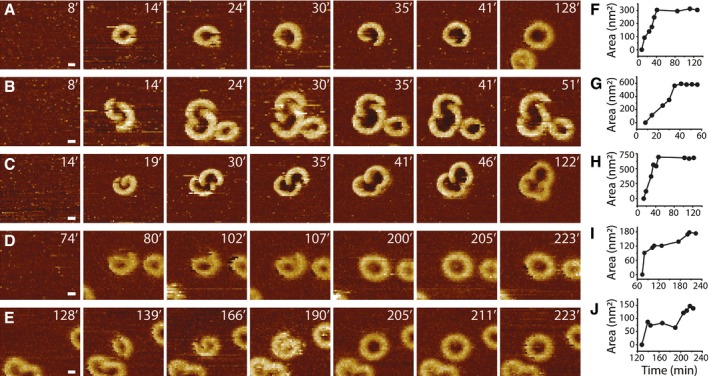
Figure EV5. Analysis of the surface area of the transmembrane pore formed by GSDMDN term oligomers over time.
-
A–ETime‐lapse AFM topographs showing the assembly and pore formation of GSDMDNterm oligomers on SLMs made from POPC, DOPG, DOPS, DOPE, and CL (40:20:10:20:10 molar ratio). Time stamps indicate minutes.
-
F–JSurface area of transmembrane pores measured in time‐lapse AFM topographs. (F) was taken from (A), (G) from (B), (H) from (C), (I) from (D), and (J) from (E).