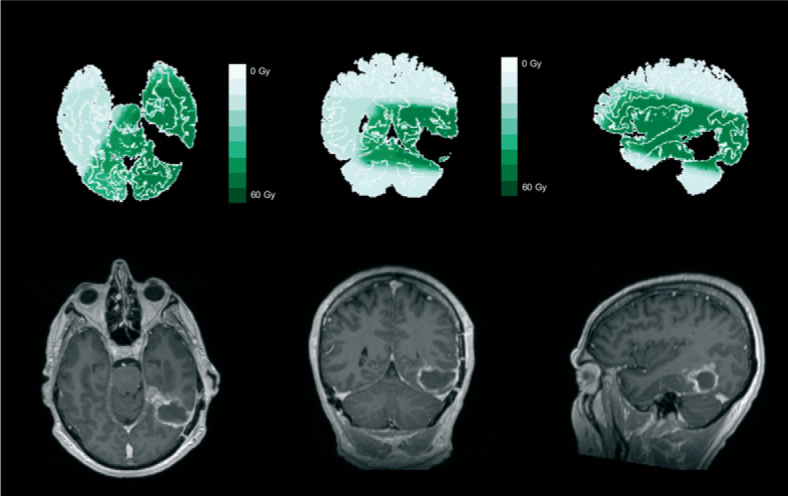
Figure 1.

Dose region distribution with corresponding pre-fractionated radiotherapy (pre-FRT) Gd-T1w image. Representative dose region distribution with corresponding pre-FRT GD-T1w image for one patient. Dose distribution was divided into seven binary regions (0–5 Gy, 5–10 Gy, 10–20 Gy, 20–30 Gy, 30–40 Gy, 40–50 Gy and 50–60 Gy). Resection cavity, post-FRT effects and tumour tissue were excluded.
