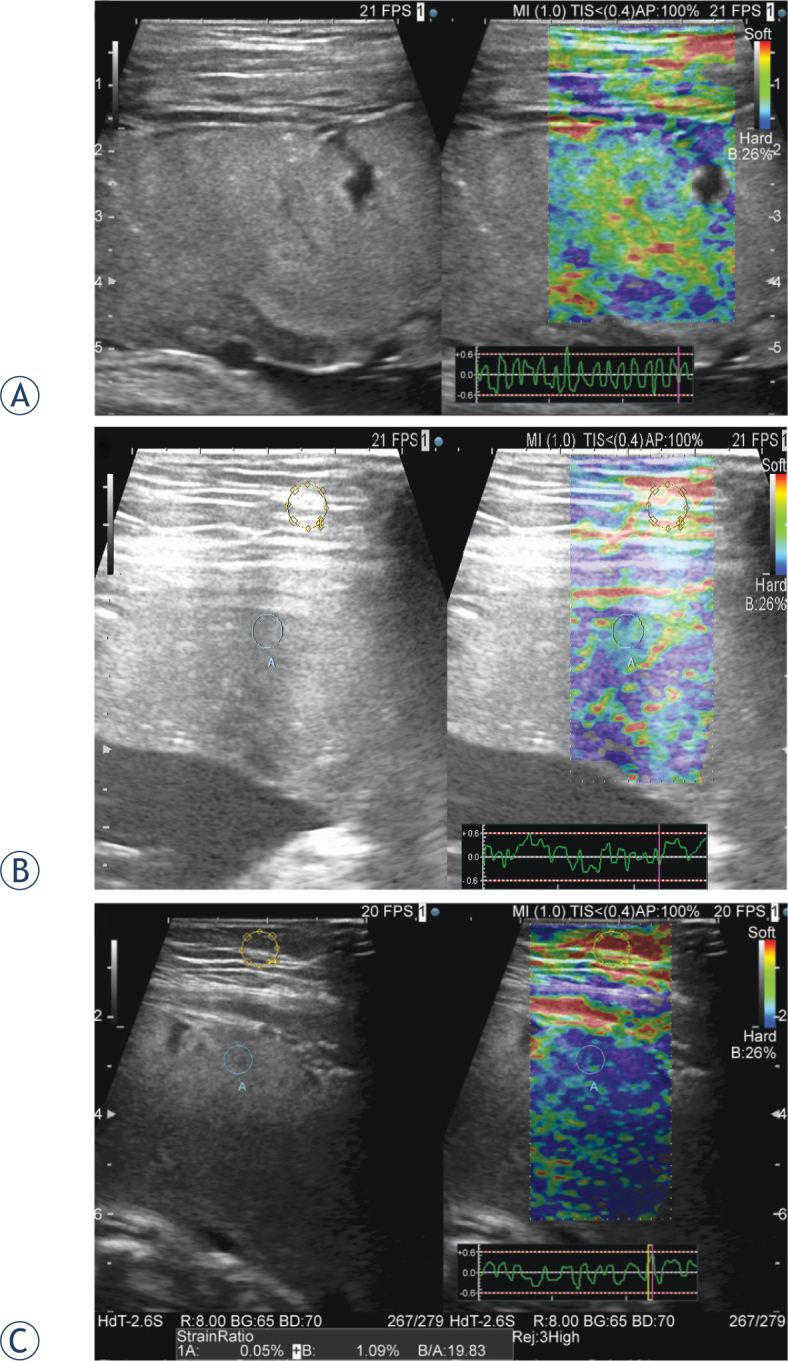
Figure 1.

Representative ultrasound images of hardness of tissue (HT) score (A) The HT score was 1 when the blue area in the ROI was 50% or less. A strain graph, used to assess proper application of compression, is indicated in the lower right (B) The blue and green areas are shown mixed together in relatively equal percentages in the placenta (C) Most of the placenta is indicated in blue. In the left image, the strain ratio is calculated from the region of interest of the fat and placental tissue. In this case, the placental index is 19.83.
