
Fig. 6.
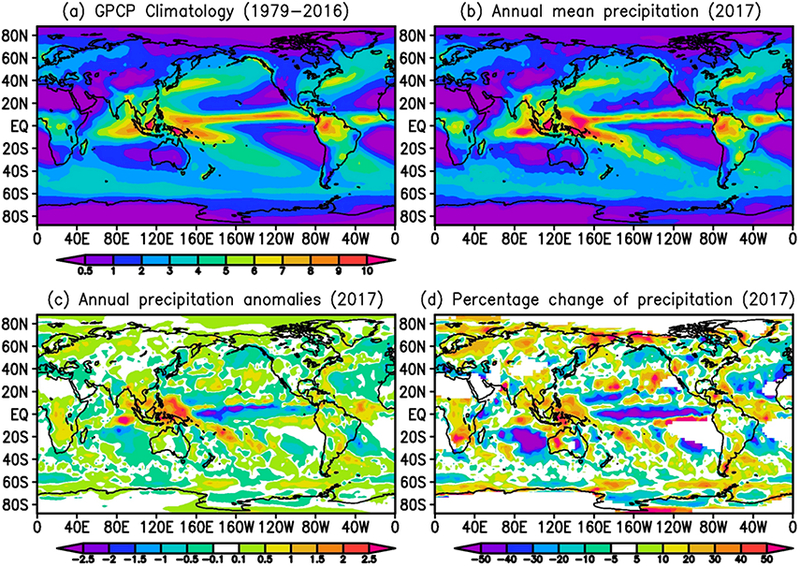
(a) GPCP climatological (1979–2016) mean precipitation (mm d−1), (b) annual mean precipitation in 2017 (mm d−1), (c) annual precipitation anomalies (mm d−1) in 2017, and (d) annual precipitation anomalies in percentages for 2017 (with areas having less than 0.5 mm d−1 of mean precipitation also shown in white).