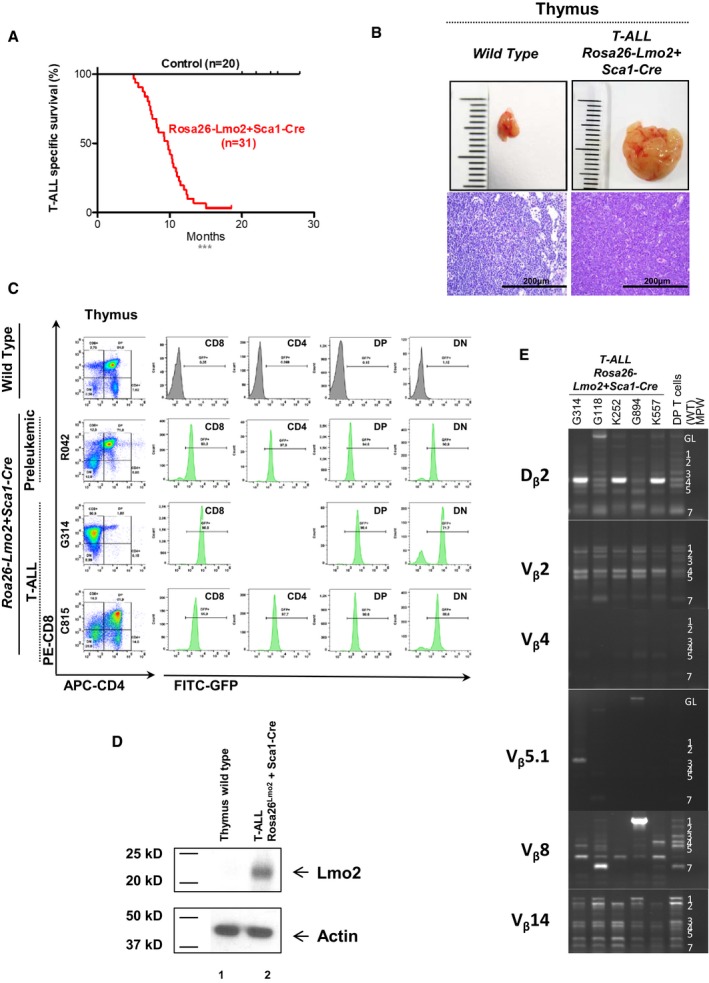
Figure 1. T‐ALL development in Rosa26‐Lmo2 + Sca1‐Cre mice.

- Leukemia‐specific survival of Rosa26‐Lmo2 + Sca1‐Cre mice (red line, n = 31), showing a significantly (log‐rank ***P < 0.0001) shortened lifespan compared to control littermate WT mice (black line, n = 20) as a result of T‐ALL development.
- An example of thymomas observed in the Rosa26‐Lmo2 + Sca1‐Cre mice studied. A thymus from a control littermate WT mouse is shown for reference. Hematoxylin and eosin staining showing infiltration of the thymus in Rosa26‐Lmo2 + Sca1‐Cre leukemic mice. Images are photographed at 400× magnification (scale bars: 200 μm).
- GFP expression in the pre‐leukemic and leukemic cells from Rosa26‐Lmo2 + Sca1‐Cre mice, respectively. A control littermate WT mouse is shown for reference.
- Western blot analysis for Lmo2 and actin in T cells from the thymus of a wild‐type mouse (1) and from the thymus of a Rosa26‐Lmo2 + Sca1‐Cre leukemic mouse (2). Tumoral cells of Rosa26‐Lmo2 + Sca1‐Cre T‐ALL showed expression of the Lmo2 protein.
- TCR clonality in Rosa26‐Lmo2 + Sca1‐Cre mice. PCR analysis of TCR gene rearrangements in infiltrated thymuses of diseased Rosa26‐Lmo2 + Sca1‐Cre leukemic mice. Sorted DP T cells from the thymus of healthy mice served as a control for polyclonal TCR rearrangements. Leukemic thymus shows an increased clonality within their TCR repertoire (indicated by the code number of each Rosa26‐Lmo2 + Sca1‐Cre mouse analyzed).
