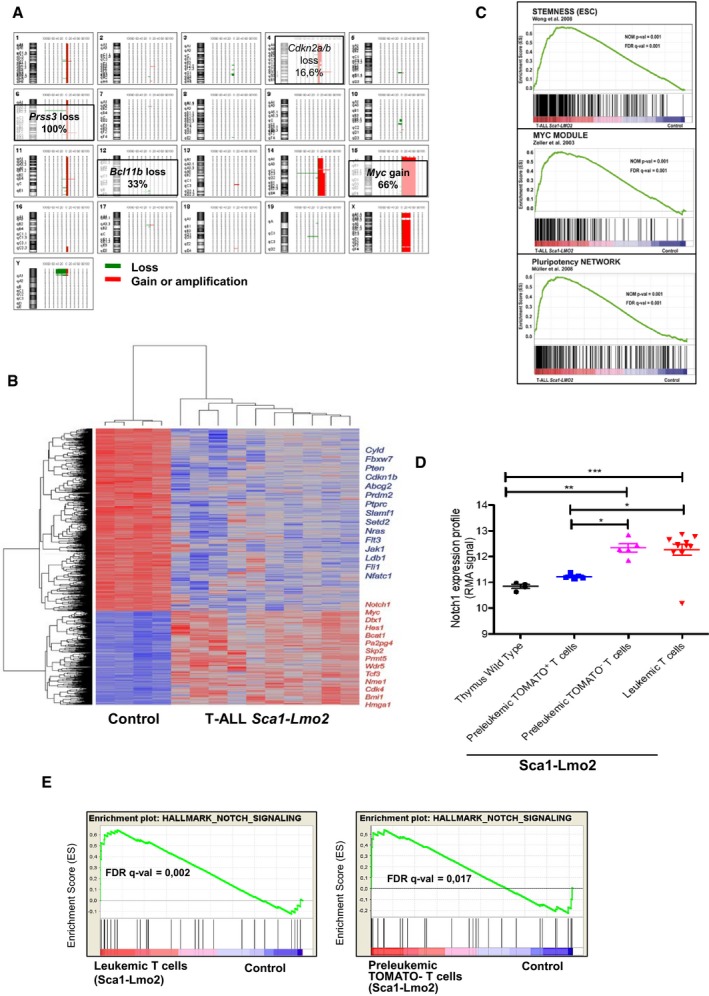
Figure 3. Molecular identity of tumor cells in Sca1‐Lmo2 T‐ALL .

- Overview of chromosomal imbalances mapped by 4x180k oligonucleotide aCGH in 12 T‐ALL cases in Sca1‐Lmo2 mice. The 20 chromosome ideograms of T‐ALL Sca1‐Lmo2 mice are shown with DNA deletions drawn as green lines and amplifications or gains as red lines. Selected chromosomal alterations are highlighted.
- Genes significantly induced or repressed within tumor T cells of Sca1‐Lmo2 mice in comparison with WT littermates, as determined by significance analysis of microarrays using FDR 1%. Each row represents a separate gene, and each column denotes a separate mRNA sample. The level of expression of each gene in each sample is represented using a red–blue color scale (upregulated genes are displayed in red and downregulated genes in blue). Selected genes are highlighted.
- GSEA of the transcriptional signatures within tumor T cells compared with control WT littermates. Gene expression data from Sca1‐Lmo2 tumor T cells showed significant enrichment in embryonic stem cell genes (Wong et al, 2008) (GSEA FDR q‐value = 0.001), Myc target genes (Zeller et al, 2003) (GSEA FDR q‐value = 0.001), and pluripotency genes (Muller et al, 2008) (GSEA FDR q‐value=0.001).
- Notch1 expression profile in control WT T cells, pre‐leukemic tomato+ T cells, pre‐leukemic tomato− T cells, and leukemic T cells. The statistical test used was Mann–Whitney U‐test: wild‐type thymus versus leukemic T cells (***P < 0.001), wild‐type thymus versus pre‐leukemic tomato− T cells (**P = 0.0031), pre‐leukemic tomato+ T cells versus leukemic T cells (*P = 0.0127), and pre‐leukemic tomato+ T cells versus pre‐leukemic tomato− T cells (*P = 0.0159). Error bars represent the mean ± SEM.
- GSEA of the Notch signaling in leukemic and tomato− cells (GSEA FDR q‐value = 0.002, 0.017, respectively).
