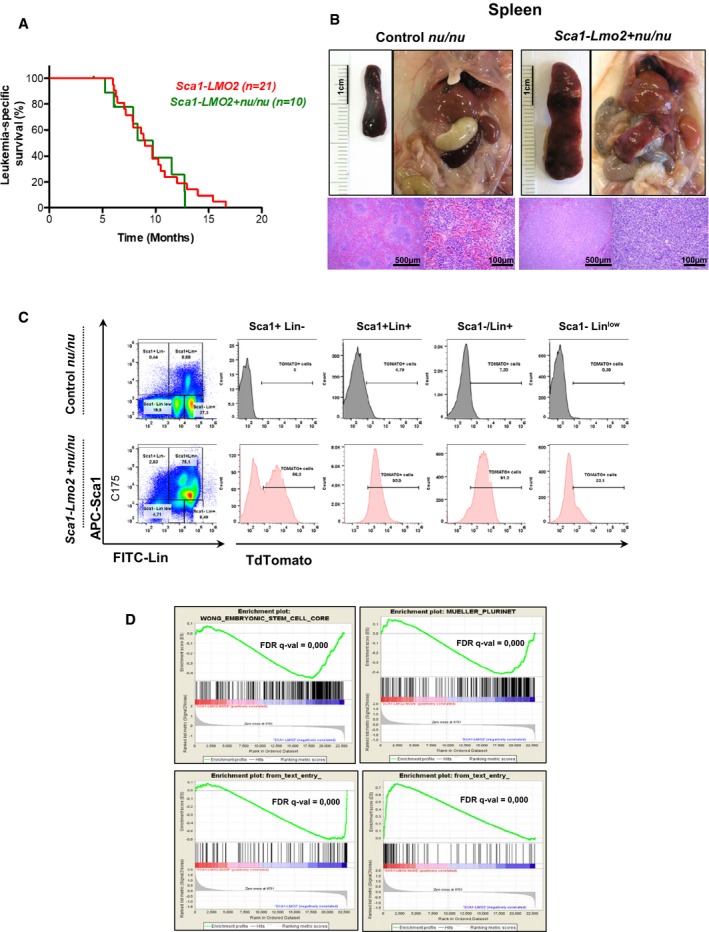
Figure 4. Leukemia development in Sca1‐Lmo2 + nu/nu mice.

- Leukemia‐specific survival of Sca1‐Lmo2 + nu/nu mice (green line, n = 10), showing a similar shortened lifespan compared to Sca1‐Lmo2 mice (red line, n = 21) as a result of leukemia development.
- An example of splenomegaly observed in Sca1‐Lmo2 + nu/nu mice studied pointing out by an arrowhead. Hematoxylin and eosin staining showing infiltration of spleen from Sca1‐Lmo2 + nu/nu leukemic mice. A spleen from a control littermate nu/nu mouse is shown for reference.
- TdTomato expression in the leukemic cells from Sca1‐Lmo2 + nu/nu mouse. A control littermate nu/nu mouse is shown for reference.
- GSEA of the transcriptional signatures within tumor cells of Sca1‐Lmo2 + nu/nu mice compared to tumor T cells of Sca1‐Lmo2 mice. Gene expression data from Sca1‐Lmo2 + nu/nu tumor cells showed significant enrichment of embryonic stem cell genes (GSEA FDR q‐value = 0.000), pluripotency genes (GSEA FDR q‐value = 0.000), genes upregulated in human ETP T‐ALL (GSEA FDR q‐value = 0.000), and genes downregulated in human ETP T‐ALL (GSEA FDR q‐value = 0.000).
