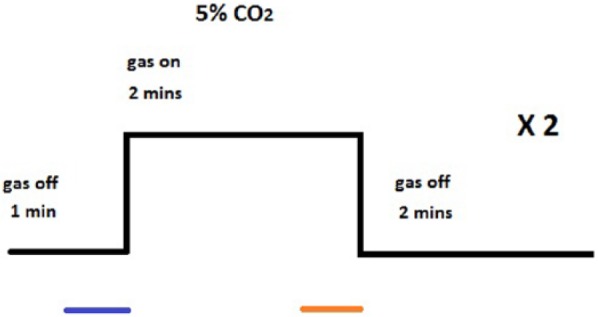
Figure 4.

Experimental design of the hypercapnia scans. 5% CO2 inhalation was used to induce hypercapnia. Blue line indicates the period where baseline etCO2 data were collected, orange line indicates the period where hypercapnia etCO2 data was collected. The BOLD data points were extracted from the average point of maximum signal change across all ROIs to the 30 seconds preceding. This equated to the sampled BOLD data points during the hypercapnia period being selected from 66 to 96 seconds after CO2 switched on in the younger group, and 72-102 seconds after CO2 switched on in the older group.
