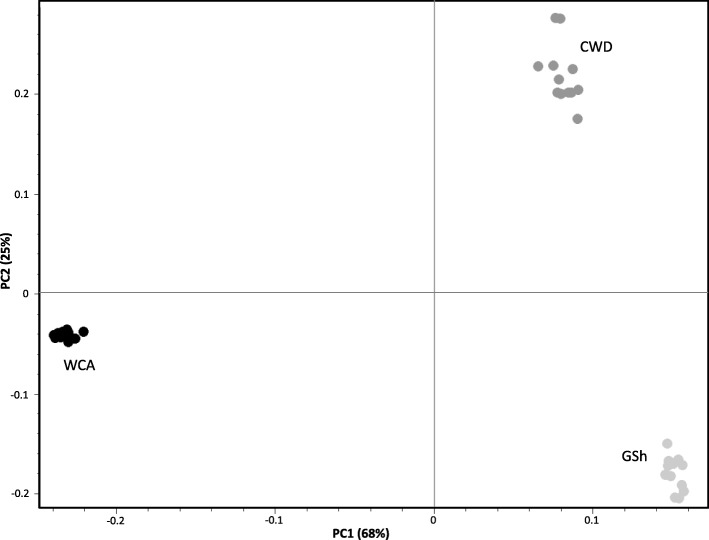
Fig. 1.
PC1 vs. PC2 results from an exploratory principal component analysis (PCA) computed in SVS on the 126k SNP dataset and including Carpathian wolves (WCA; black dots), German Shepherds (GSh; light grey dots), and Czechoslovakian Wolfdogs (CWD; dark gray dots). The two axes are not to scale, in order to better distinguish individuals along PC2

