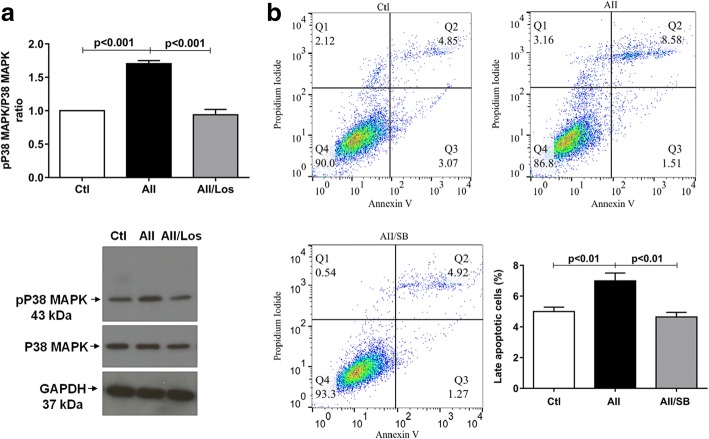
Fig. 4.
a Relative expression and representative bands of phosphorylated and non- phosphorylated p38 MAPK in control and treated podocytes. GAPDH was used as internal control; the values are mean ± S.E. of 4 experiments. b Podocyte apoptosis in control, Ang II (1 μM) and/or SB203580 (0.1 μM) treated cells, for 24 h, detected by flow cytometry using Annexin V/propidium iodide staining Q1, cells in necrosis; Q2, cells in late apoptosis; Q3, cells in early apoptosis and Q4, healthy cells. Late apoptosis quantification is expressed as mean ± SEM of 5–6 experiments, in triplicate

