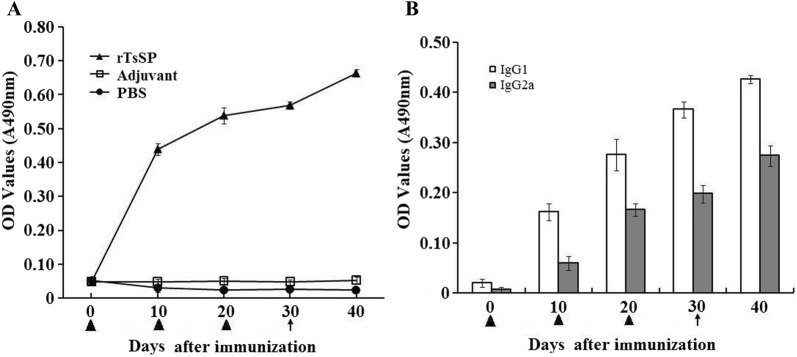
Figure 14.
Analysis of anti-rTsSP IgG responses in mice vaccinated with rTsSP. A Anti-rTsSP IgG levels in sera of immunized mice at diverse time intervals after immunization. B The IgG subclass response of immunized mice was observed at diverse time intervals after immunization. The OD values of each group are the mean ± SD of 10 mice. The vaccination times are marked as a triangle, and challenge infection time is marked as an arrow.

