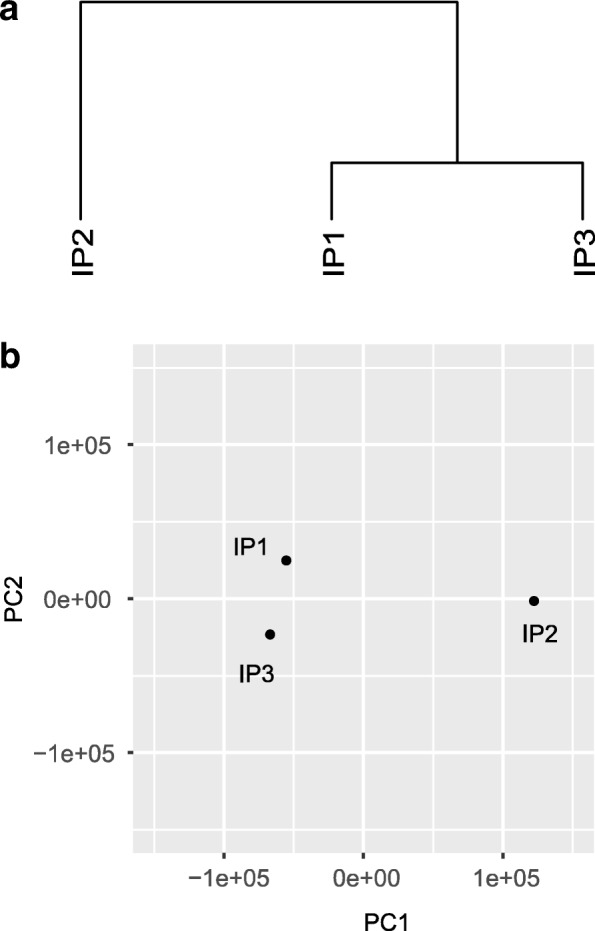
Fig. 4.

Hierarchical clustering and PCA analysis of the samples. Hierarchical clustering and PCA analysis is performed to show relative similarity of the samples. As shown in Fig. 4, the IP2 sample is more different from the other samples based on both hierarchical clustering analysis (a) and PCA analysis (b). The analysis of samples were performed based on the normalized reads counts of all the bins in the transcriptome in R. Specifically, the hierarchical clustering is implemented with hclust command based on Euclidean distance and the default setting; while the PCA analysis is implemented with the prcomp function in the stats R package
