Fig. 1.

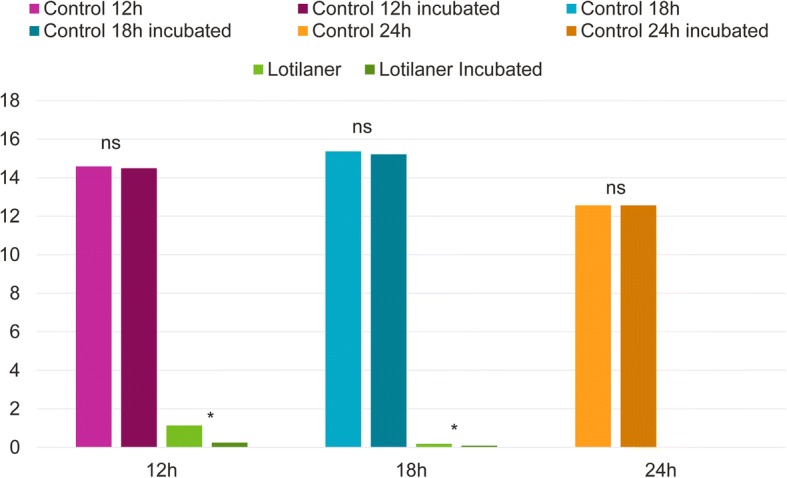
Geometric mean tick counts of the control and the lotilaner-treated groups before and after incubation on Day 0 at 12 h, 18 h and 24 h post-treatment. Within-group comparisons before and after incubation: ns, P > 0.05; *P < 0.05

Geometric mean tick counts of the control and the lotilaner-treated groups before and after incubation on Day 0 at 12 h, 18 h and 24 h post-treatment. Within-group comparisons before and after incubation: ns, P > 0.05; *P < 0.05