
Fig. 2.
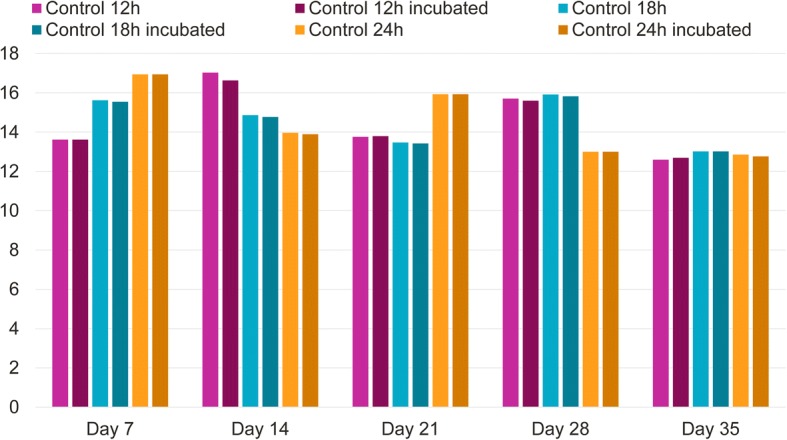
Geometric mean tick counts of the control groups before and after incubation on Days 7, 14, 21 and 28 at 12, 18 and 24 h post-infestation. P > 0.05 at all time points, for the within-group comparison before and after incubation
Official websites use .gov
A
.gov website belongs to an official
government organization in the United States.
Secure .gov websites use HTTPS
A lock (
) or https:// means you've safely
connected to the .gov website. Share sensitive
information only on official, secure websites.
Geometric mean tick counts of the control groups before and after incubation on Days 7, 14, 21 and 28 at 12, 18 and 24 h post-infestation. P > 0.05 at all time points, for the within-group comparison before and after incubation