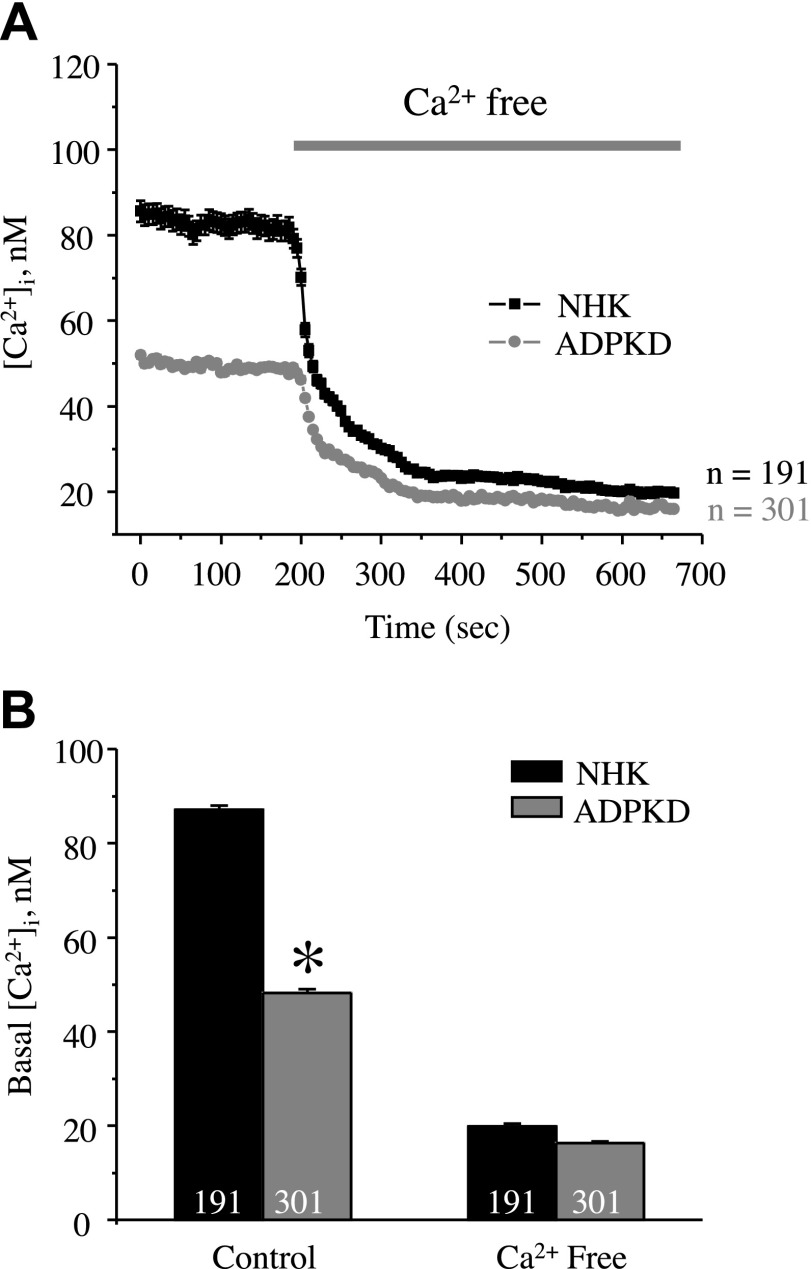
Figure 1.
Differences in basal [Ca2+]i levels between NHK and ADPKD cells depend on extracellular Ca2+. A) Summary graph of averaged changes of [Ca2+]i in control and upon the application of Ca2+-free medium (5 mM EGTA, as noted by a bar on the top) in NHK cells (black trace) and ADPKD cells (gray trace). B) Summary graphs of basal [Ca2+]i in NHK and ADPKD cells in the control and in Ca2+-free medium. Asterisk denotes significant decrease vs. NHK cells. *P < 0.05.

