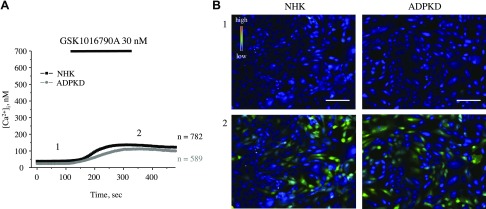
Figure 10.
Impaired TRPV4 activity in NHK and ADPKD cells that were treated with tunicamycin. A) Summary graph of averaged changes of [Ca2+]i at baseline and upon the application of the TRPV4 agonist, GSK1016790A (shown with a black bar on the top), in NHK cells (black trace) and ADPKD cells (gray trace) after pretreatment with tunicamycin (5 µg/ml) for 24 h to block glycosylation. B) Representative pseudocolor images (blue–low and red–high [Ca2+]i) at time point 1 (control) and time point 2 (GSK1016790A) from experiments shown in panel A. Scale bars, 60 µm.

