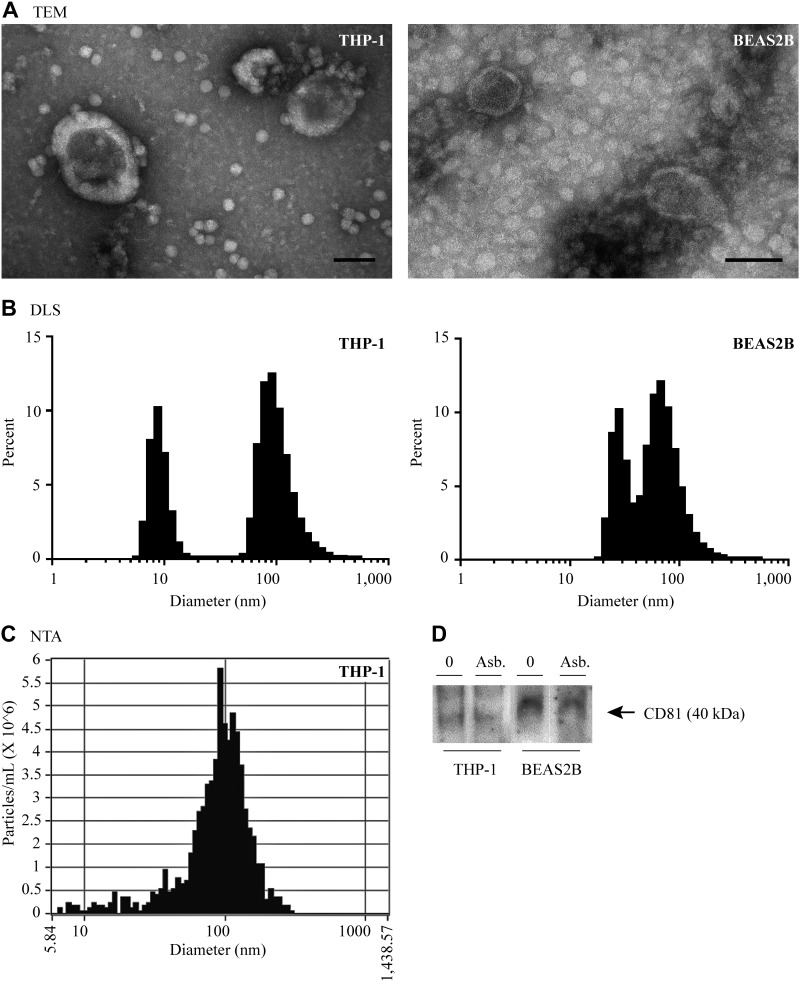
Figure 1.
Exosome isolation and characterization from human bronchial epithelial (BEAS2B) cells and THP-1 macrophages. A) TEM showing exosome membrane-bound structures and proper size range. Scale bars, 100 nm. B) DLS indicating exosome size distribution. C) NTA indicating exosome size distribution and concentration of particles. D) Western blot analysis for presence of exosome marker CD81.

