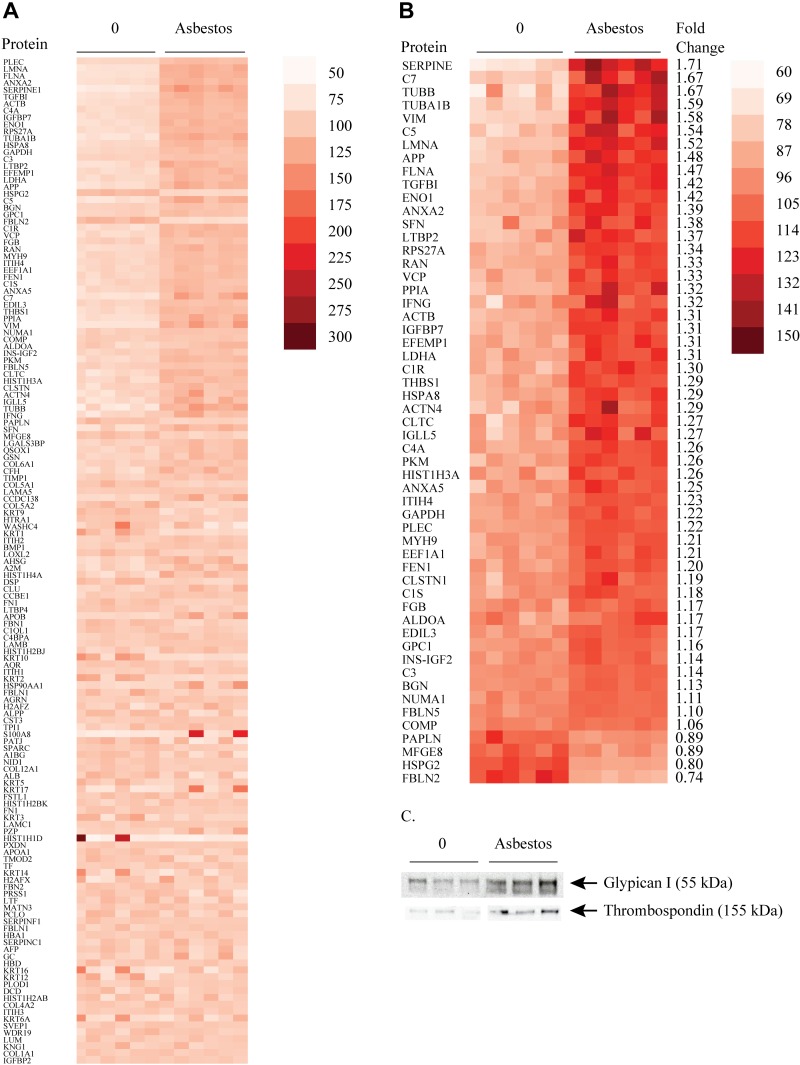
Figure 2.
Proteomic analysis of exosomes from asbestos-exposed and control BEAS2B cells showed different protein signatures. A) Heat map indicating the abundances of all proteins identified in both groups. B) Enlarged heat map section showing all differentially abundant proteins with values of P < 0.05 (1 TMT experiment: asbestos vs. control, 3 biologic replicates, 2 technical replicates), listed according to fold change. C) Validation immunoblot of exosomal proteins glypican-1 and thrombospondin.

