Figure 4.
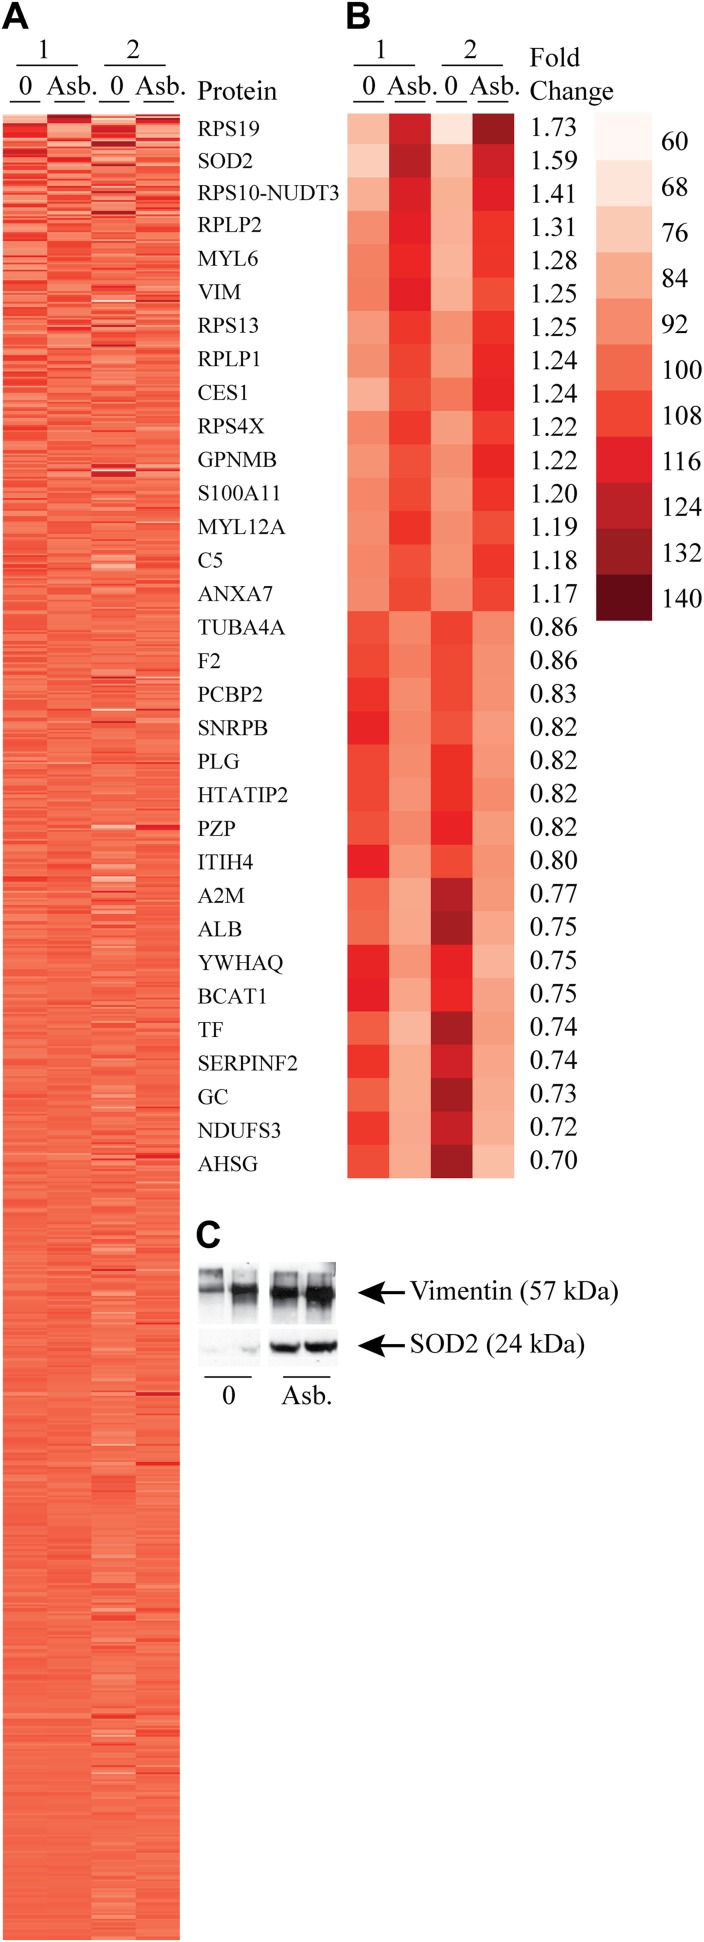
Proteomic analysis showed proteins of differential abundances in asbestos-exposed exosomes from THP-1. A) Heat map indicating the abundance of all proteins identified in both groups, sorted according to P value (1, 2 indicate 2 separate TMT experiments). B) Expanded heat map region showing exosomal proteins with differential abundances between control group and asbestos-exposed group with P < 0.05 (asbestos vs. control, 2 biologic replicates), listed according to fold change. C) Validation immunoblot of exosomal proteins vimentin and SOD2.

