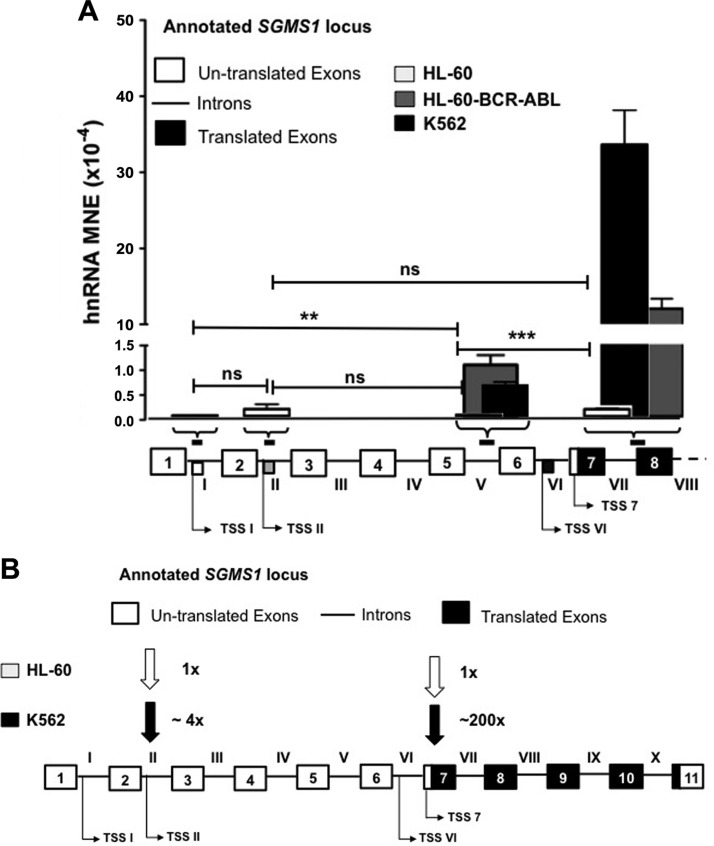
Figure 5.
Bcr-Abl transforms the transcriptional landscape of SGMS1. A) Bar graph displays qRT-PCR data of hnRNA abundance with primers at intron I, II, and V and intron VII–exon 8 in Bcr-Abl–positive (K562 and HL-60-Bcr-Abl) and negative (HL-60) cells. Shown below the bar graph are the (approximate) regions on the SGMS1 locus targeted by primers used (primer sequences are provided in Supplemental Table 1) and the position of the different TSSs that were identified in K562 cells. Results represent 3 independent qRT-PCR experiments. B) Graphical representation of the transcriptional landscape of SGMS1 in Bcr-Abl–positive vs. –negative cells. Arrows indicate the utilization of different TSSs in Bcr-Abl–positive and –negative cells with fold abundance compared with TSS II in HL-60 cells, as quantified from qRT-PCR data. The SGMS1 locus is graphically represented (white boxes represent untranslated exons, black boxes represent translated exons, and lines represent introns). **P < 0.005, ***P < 0.0005.

