Fig. 7.

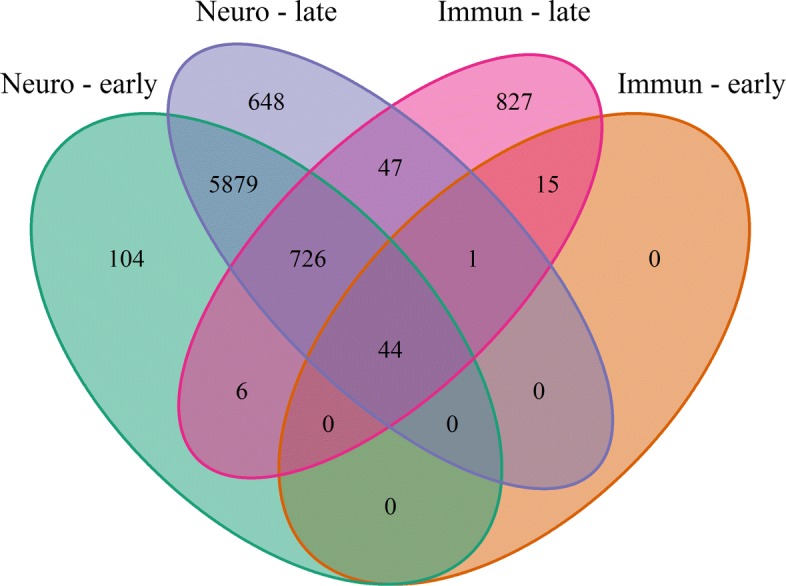
Comparison of the results of neurological and immunological tissues. Each group is further separated by early and late merging. The numbers show the amount of DEGs of each analysis variant, as well as their overlaps

Comparison of the results of neurological and immunological tissues. Each group is further separated by early and late merging. The numbers show the amount of DEGs of each analysis variant, as well as their overlaps