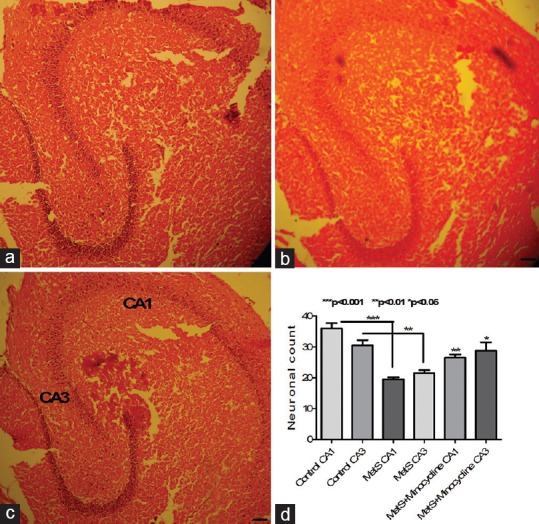
Figure 4.

Photomicrographs of hippocampal region of mice brain. (a) Control showing healthy neurons; (b) metabolic syndrome animals showing loss of hippocampal neurons at CA1 and CA3 regions when compared to control; (c) minocycline-treated metabolic syndrome group showing partial reversal of metabolic syndrome-induced neuronal damage; (d) metabolic syndrome animals showing significant loss of CA1 and CA3 neurons compared to control animals. This loss was partially reversed upon minocycline treatment. Representative image from each group (n = 5) stained with H and E (10 × 10). ***P < 0.001, **P < 0.01, *P < 0.05 all values are expressed as mean ± standard error of the mean
