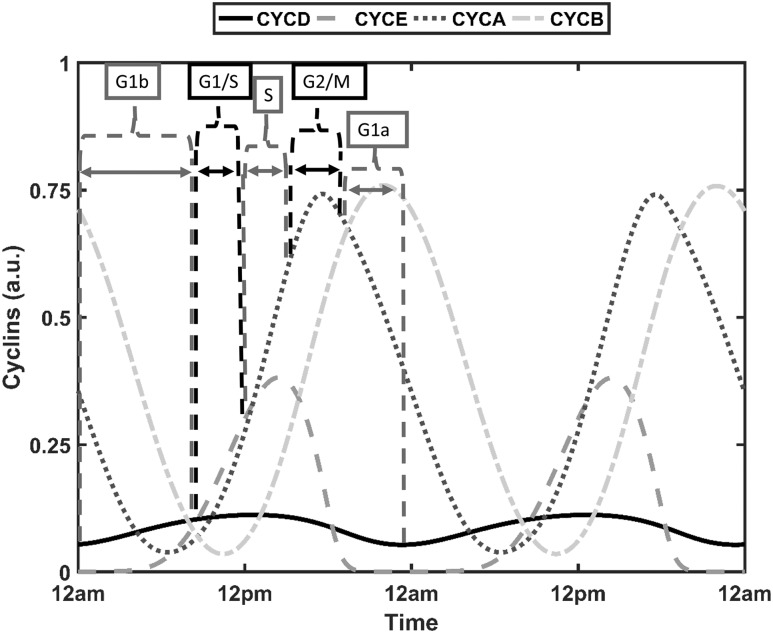
Figure 11.
Cyclin levels used for cell-cycle phase determination in single cells. For each individual cell in the heterogeneous population, the G1a phase ranges from 90% of the CYCB peak to the minimum of CYCD, the G1b phase from the minimum of CYCD to 90% of the CYCD peak, the G1/S phase from 90% of CYCD to 90% of the CYCE peak, the S phase from 90% of the CYCE peak to 90% of the CYCA peak, and the G2/M phase from 90% of CYCA peak to 90% of the CYCB peak.

