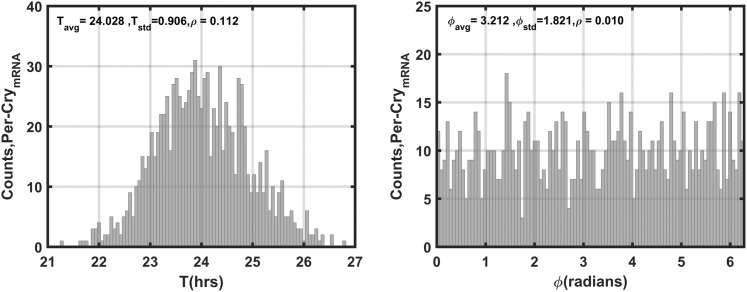
Figure 4.
Distributions of Per–CrymRNA periods and phases for the unentrained oscillators. In the absence of entraining signals, intercellular variability results in asynchrony among Per–CrymRNA oscillators. The population exhibits a mean period (Tavg) of ∼24 hours with a standard deviation (Tstd) of ∼0.9 hours. The average phase of oscillation (ϕavg) is ∼3.2 radians with a standard deviation (ϕstd) of ∼1.8. The low ρ values for both circadian measures reflect population asynchrony.

