. 2018 Jul 2;20(27):18176–18183. doi: 10.1039/c8cp02574f

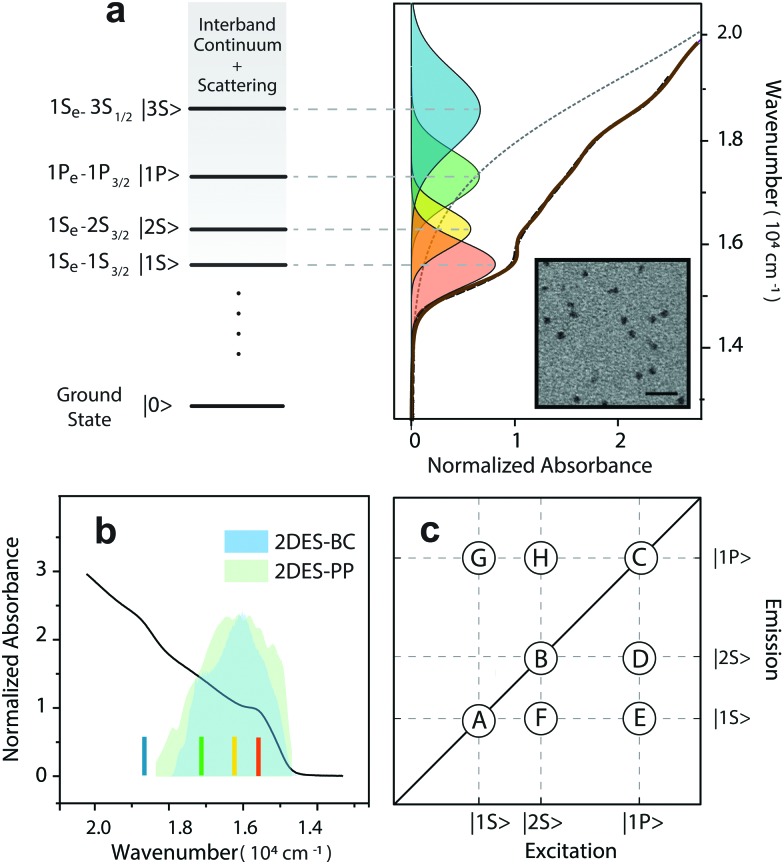
Fig. 1. (a) Absorption spectrum of CdSe/ZnS QDs in chloroform (brown solid line). Transitions are assigned by cumulative multi-gaussian peak fitting (black dashed line). Each Gaussian peak is attributed to an exciton transition, according to ref. 43. Transmission electron microscopy (TEM) micrographs of CdSe/ZnS QDs obtained by a JEOL JEM-1011 microscope operating at 100 kV is reported in the inset (scale bar 20 nm). (b) Comparison between exciton transitions and laser bandwidth employed for the 2D experiments. Colored lines indicate the peaks of exciton transitions in the absorption spectrum. The color code is maintained across panels. (c) Coordinates of the main signals expected in the 2D maps. Diagonal signals: A (15 600, 15 600 cm–1), B (16 200, 16 200 cm–1), and C (17 100, 17 100 cm–1), are associated with |1S ), are associated with |1S 〉, |2S〉 and |1P〉 states, respectively. Below diagonal peaks: D (17 100, 16 200 cm, |2S), are associated with |1S 〉, |2S〉 and |1P〉 states, respectively. Below diagonal peaks: D (17 100, 16 200 cm and |1P), are associated with |1S 〉, |2S〉 and |1P〉 states, respectively. Below diagonal peaks: D (17 100, 16 200 cm states, respectively. Below diagonal peaks: D (17 100, 16 200 cm–1), E (17 100, 15 600 cm–1), and F (16 200, 15 600 cm–1), are associated with coupling between |2S), are associated with coupling between |2S〉 and |1P 〉, |1S〉 and |1P 〉, and |1S〉 and |2S 〉, respectively. Above diagonal signals: G (15 600, 17 100 cm and |1P ), are associated with coupling between |2S〉 and |1P 〉, |1S〉 and |1P 〉, and |1S〉 and |2S 〉, respectively. Above diagonal signals: G (15 600, 17 100 cm, |1S), are associated with coupling between |2S〉 and |1P 〉, |1S〉 and |1P 〉, and |1S〉 and |2S 〉, respectively. Above diagonal signals: G (15 600, 17 100 cm and |1P ), are associated with coupling between |2S〉 and |1P 〉, |1S〉 and |1P 〉, and |1S〉 and |2S 〉, respectively. Above diagonal signals: G (15 600, 17 100 cm, and |1S), are associated with coupling between |2S〉 and |1P 〉, |1S〉 and |1P 〉, and |1S〉 and |2S 〉, respectively. Above diagonal signals: G (15 600, 17 100 cm and |2S ), are associated with coupling between |2S〉 and |1P 〉, |1S〉 and |1P 〉, and |1S〉 and |2S 〉, respectively. Above diagonal signals: G (15 600, 17 100 cm, respectively. Above diagonal signals: G (15 600, 17 100 cm–1), and H (16 200, 17 100 cm–1) reflect the spectral coupling between |1P) reflect the spectral coupling between |1P〉, |1S〉, and |2S〉 transitions., |1S) reflect the spectral coupling between |1P〉, |1S〉, and |2S〉 transitions., and |2S) reflect the spectral coupling between |1P〉, |1S〉, and |2S〉 transitions. transitions.

Fig. 1