. 2018 Jul 2;20(27):18176–18183. doi: 10.1039/c8cp02574f

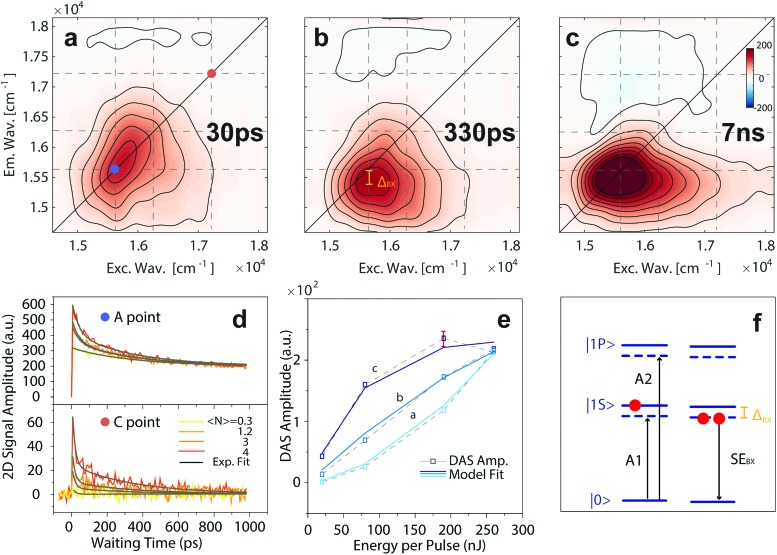
Fig. 4. (a–c) Results of the global fitting analysis for the 2DES-PP measures on CdSe/ZnS QDs; the dynamics is decomposed into three DASs. The associated time constants are reported in each panel (30, 330 ps and 7 ns, respectively). (d) Power dependence of the signal recorded at coordinates A, and C, ascribed to the |1S, ascribed to the |1S〉 and |1P〉 population, respectively. (e) Model fitting of the power dependent amplitudes for the three DASs reported in the upper panels. The plotted error bar was estimated through the analysis of two different datasets. (f) Energy levels of the typical signal arising from the single and bi-exciton population in the QDs. Adapted from and |1P, ascribed to the |1S〉 and |1P〉 population, respectively. (e) Model fitting of the power dependent amplitudes for the three DASs reported in the upper panels. The plotted error bar was estimated through the analysis of two different datasets. (f) Energy levels of the typical signal arising from the single and bi-exciton population in the QDs. Adapted from population, respectively. (e) Model fitting of the power dependent amplitudes for the three DASs reported in the upper panels. The plotted error bar was estimated through the analysis of two different datasets. (f) Energy levels of the typical signal arising from the single and bi-exciton population in the QDs. Adapted from ref. 13 and 15.

Fig. 4