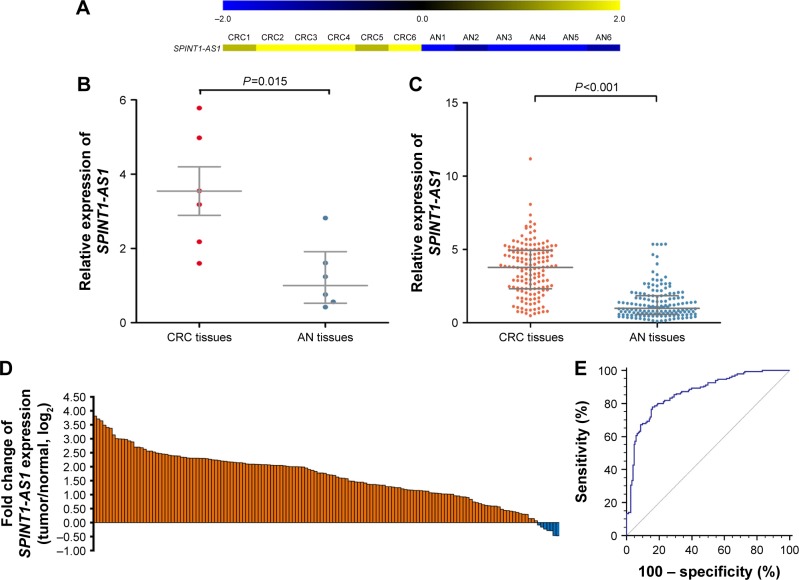
Figure 1.
SPINT1-AS1 was up-regulated in CRC tissues.
Notes: (A) Heat map of lncRNA microarray data showing expression level of SPINT1-AS1 in CRC tissues (n=6) and matched AN tissues (n=6). (B) Strand-specific RT-qPCR analysis of SPINT1-AS1 expression level in six paired CRC tissues and AN tissues used for lncRNA microarray analysis. P=0.015 by Wilcoxon signed-rank test. Data are shown as median with interquartile range. (C) Strand-specific RT-qPCR analysis of SPINT1-AS1 expression level in 150 paired CRC tissues and AN tissues. P<0.001 by Wilcoxon signed-rank test. Data are shown as median with interquartile range. (D) Expression of SPINT1-AS1 in 150 CRC tissues. The data are shown as log2-fold change in tumor tissues normalized to AN tissues expression. (E) ROC curves for discriminating CRC tissues from AN tissues.
Abbreviations: lncRNA, long non-coding RNA; SPINT1-AS1, serine peptidase inhibitor, Kunitz type 1 antisense RNA1; CRC, colorectal cancer; AN, adjacent normal tissues; RT-qPCR, real-time quantitative polymerase chain reaction; ROC, receiver operating characteristic.

