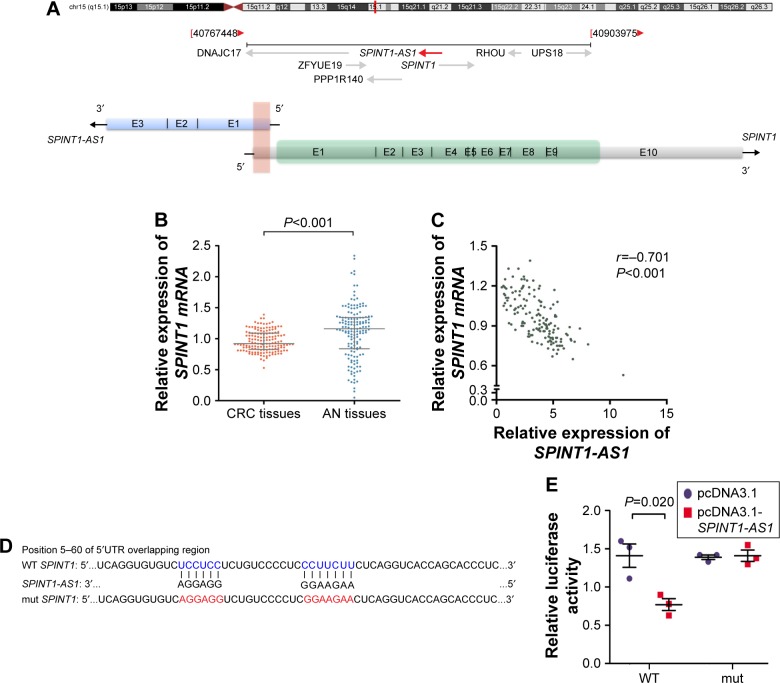
Figure 2.
The correlation between SPINT1-AS1 and SPINT1 mRNA.
Notes: (A) Upper chart of this panel shows genomic locus of the SPINT1 indicated on the UCSC site. Lower chart of this panel is a schematic representation of SPINT1-AS1 and SPINT1 mRNA. “E” represents exons. Red shadow represents overlapping region of SPINT1-AS1 and SPINT1 mRNA. Green shadow represents CDS region of SPINT1 mRNA. Black arrows show the direction of transcription. The schema is in scale. (B) Strand-specific RT-qPCR analysis of SPINT1 mRNA expression level in 150 paired CRC tissues and AN tissues. P<0.001 by Wilcoxon signed-rank test. Data are shown as median with interquartile range. (C) The correlation between SPINT1-AS1 and SPINT1 mRNA expression levels was analyzed by Spearman’s rank correlation analysis. (D) Schematic of wide-type (WT) and mutant (mut) overlapping 5′UTR sequences used in dual luciferase reporter assay. (E) Luciferase activity in SW480 co-transfected with luciferase reporters containing WT or mut 5′UTR overlapping sequence and pcDNA3.1-SPINT1-AS1 or negative control. Data are presented as the relative ratio of firefly luciferase activity to Renilla luciferase activity. P=0.020.
Abbreviations: SPINT1-AS1, serine peptidase inhibitor, Kunitz type 1 antisense RNA1; CRC, colorectal cancer; RT-qPCR, real-time quantitative polymerase chain reaction; UCSC, University of California Santa Cruz; CDS, coding sequence.

