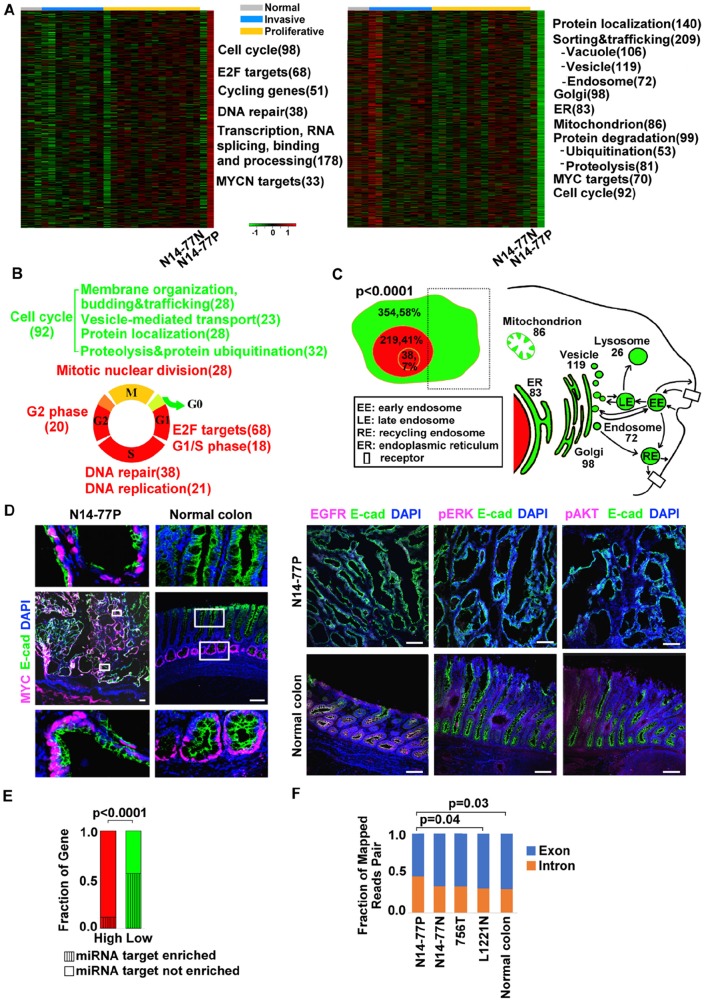
Figure 4. Highly- and lowly expressed genes in N14-77 polyps differ in function, cell cycle phase, cellular location and miRNA target site enrichment.
(A) Heatmaps from left to right indicate the log2 (FPKM) values of 474 highly- and 614 lowly expressed genes in 28 canine intestinal samples grouped as shown. Significantly enriched functions are listed next to the heatmap, with the total number of genes involved shown in the parenthesis. (B) Red and green respectively designate highly and lowly expressed genes, along with their enriched functions and cell cycle phases. Yellow indicates cell cycle phases enriched in both highly and lowly expressed genes. (C) Highly expressed genes are enriched in the nucleus (red) and lowly expressed genes are enriched in the cytoplasm (green), e.g., “354, 58%” indicating 354 genes, which make up 58% of all lowly expressed genes, located in the cytoplasm. The small red circle inside the nucleus designates the nucleolus. The right image illustrates that the sub cellular locations of lowly expressed genes, e.g., 83 genes are associated with ER. (D) Representative IHC images illustrate the enrichment of nuclear protein MYC, and the depletion of membrane and cytoplasmic proteins EGFR, pERK and pAKT, in N14-77 polyps. Scale bar, 100 μm. (E) Highly and lowly expressed genes differ in enriched miRNA target sites. (F) More RNA-seq reads were mapped to intronic regions in N14-77 polyps. 756T is a canine jejunum tumor and others are described in Figure 2E.

