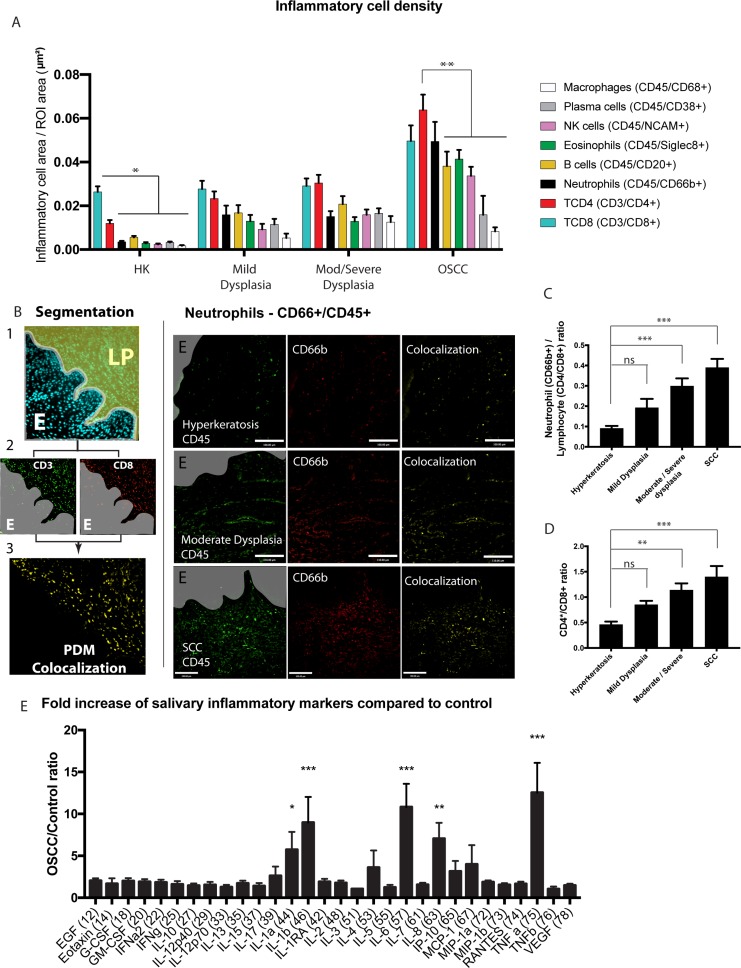
Figure 1. Increased recruitment of inflammatory cells in primary OSCC tumors.
(A) Inflammatory cell area (µm2) standardized to a region of interest (ROI) in samples from patients diagnosed with hyperkeratosis (HK), mild dysplasia, moderate/severe dysplasia, or OSCC. The inflammatory cells were identified by semi-automated colocalization of 2 markers for each cell using FIHC. n = 39 samples total (hyperkeratosis n = 9, mild dysplasia n = 9, moderate/severe dysplasia n = 10, OSCC n = 10). (B) Left panel: Representative image showing the steps of data analysis – 1- segmentation in epithelium-E and lamina propria-LP, 2- colocalization and 3- quantification. Right panel: Representative images of patient samples diagnosed with hyperkeratosis, moderate dysplasia, and OSCC showing colocalization (yellow, overlay) of CD45 (green) and CD66b (red). Scale bar, 100 μm. Gray areas represent the epithelium or OSCC identified in the DAPI channel. (C) Ratio of neutrophil (CD66b+) to lymphocyte (CD4+ and CD8+). The ratio was calculated using the normalized inflammatory cell area of neutrophils divided by the combined CD4 and CD8 positive inflammatory area in each sample as described in panel A. Similarly, CD4 inflammatory cell area divided by CD8 in each sample was used to calculate the CD4/CD8 ratio (D). (E) The salivary inflammatory markers were quantified using a Multiplexing Luminex based assay. Saliva was collected from 13 control patients and 17 OSCC patients as described in the materials and methods section. The results are normalized to control samples. Inflammatory area or ratios are presented as columns ± SEM. One-way ANOVA followed by Dunnett’s multiple comparison test: *P < 0.05; **, P < 0.01; ***, P < 0.001.

