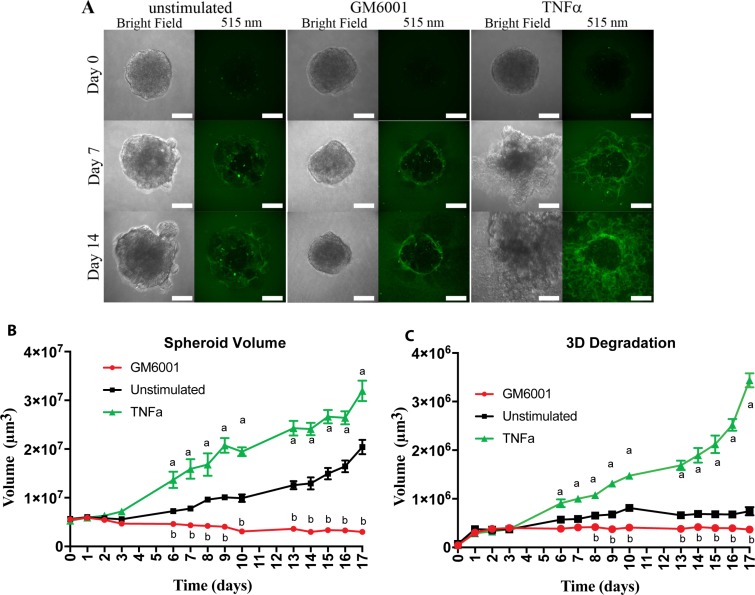
Figure 3. TNFα stimulation of OSCC cells leads to increased matrix degradation and spheroid volume.
(A) Representative confocal images of UMSCC1 formed spheroids at Day 0, 7, and 14. Spheroid volume was revealed through bright-field imaging and Geltrex degradation through 505 nm excitation of BSA-Green degradation marker. Scale bar, 100 μm. (B) Spheroid volume over a period of 17 days in the presence or absence of TNFα (10 ng/mL) or GM6001 (25 µM). (C) Geltrex degradation volume over a period of 17 days in the presence or absence of TNFα (10 ng/mL) or GM6001 (25 µM). Volumes are presented as mean per spheroid ± SEM. Two-way ANOVA followed by Bonferroni post hoc test: a, P < 0.01 TNFα vs. unstimulated; b, P < 0.01 for GM6001 vs. unstimulated; n = 3.

