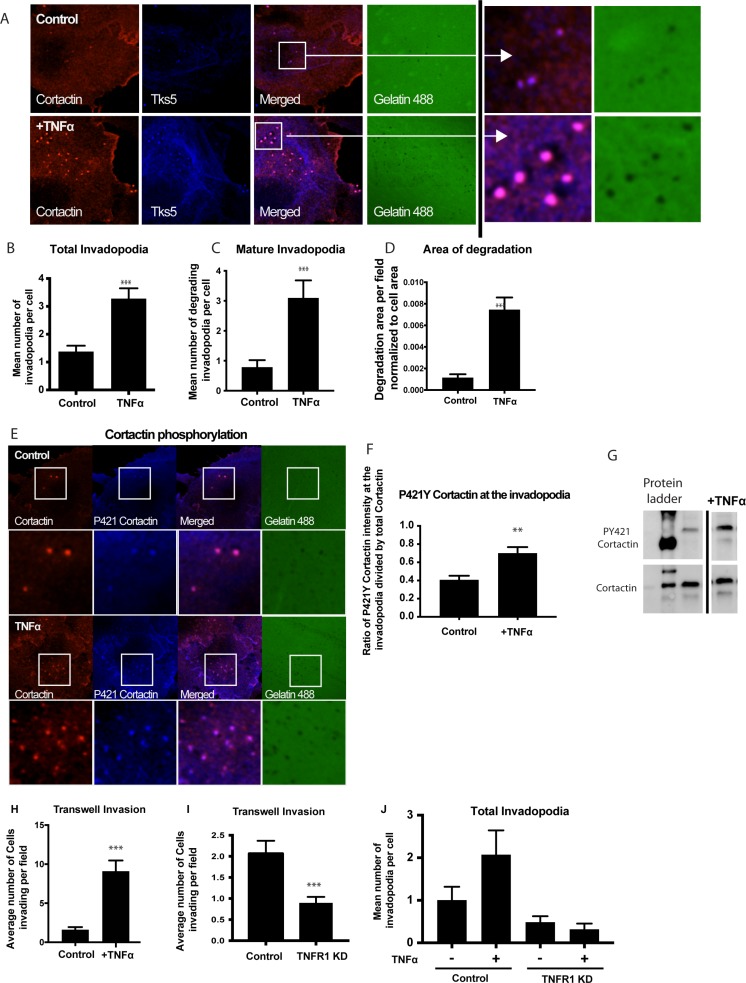
Figure 4. Treatment with TNFα stimulates invadopodium formation in UMSCC1 cells.
UMSCC1 cells were plated on a thin gelatin matrix and incubated for 24 hours in the presence or absence of TNFα (10 ng/mL). (A) Representative images of UMSCC1 cells forming invadopodia in green fluorescence gelatin - cortactin (red), Tks5 (blue) and gelatin (green). The total number of invadopodia (B) and mature invadopodia (C) per cell were counted. Area of gelatin degradation was measured in the while field and normalized to the area of the cell in the field (D). Representative images of cortactin phosphorylation in invadopodia formed in UMSCC1 cell in the presence or absence of TNFα (10 ng/mL). Cortactin (red), P421 Cortactin (blue), gelatin (green) (E). We have calculated the ratio of mean pixel intensity (MFI) of phosphorylated P421Y cortactin at the invadopodia in the presence or absence of TNFα (10 ng/mL) and divided by the MFI of total cortactin in the same pixel, and the results are shown in (F). A total of 76 cells were analyzed in 3 experiments. Representative western blot of cortactin tyrosine residue 421 phosphorylation and total cortactin expression after TNFα stimulation. (G). For transwell experiments, we calculated the average number of UMSCC1 cells invading per Transwell imaging field (H) in UMSCC1 cells with TNFR1 knockdown (I) and the formation of invadopodia (J) in the presence or absence of TNFα (10 ng/mL). One-way ANOVA followed by Dunnett’s multiple comparison test: **P < 0.01; ***, P < 0.001. n = 3 for invadopodia experiments and western blot, n = 5 for transwell experiments.

