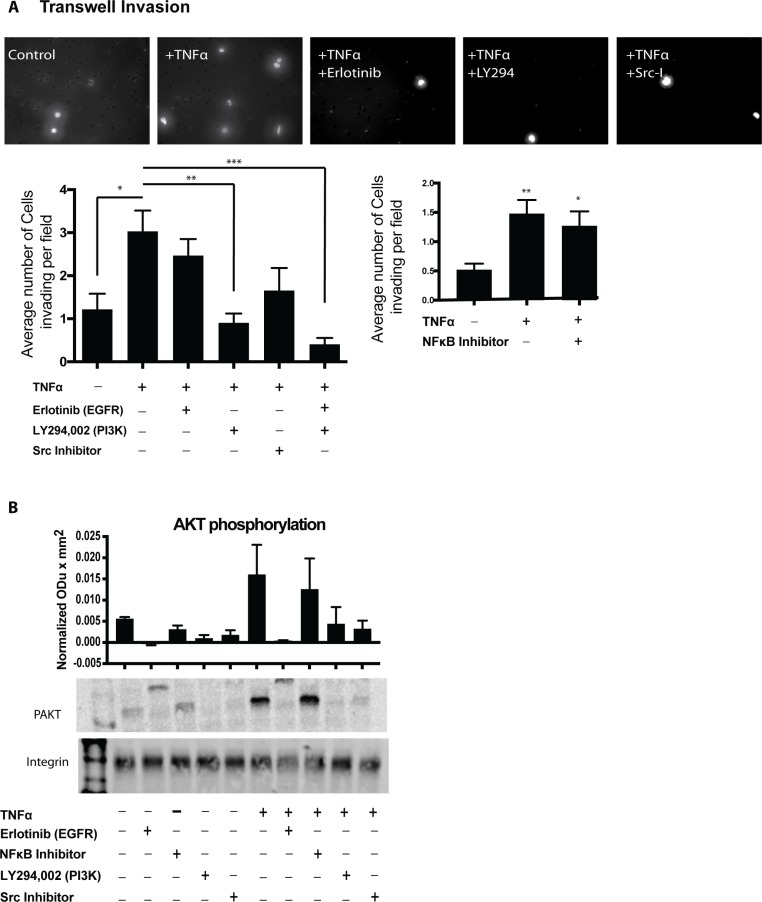
Figure 5. PI3K and Src inhibition lead to decreased OSCC invasion.
(A) UMSCC1 cells were plated in the upper chamber and incubated in the presence or absence of TNFα (10 ng/mL) without or with inhibitors. Cell invasion was calculated as the average cell coverage area under the membrane after 24-hour incubation. Two-way ANOVA followed by Bonferroni post hoc test: *P < 0.05 for TNFα (10 ng/mL) control vs. unstimulated control. **, P < 0.01; ***, P < 0.001 for inhibitor treatment vs. TNFα (10 ng/mL) control. (B) Representative western blot showing the expression of PAKT in UMSCC1 cells following TNFα (10 ng/mL) stimulation without or with inhibitors. Representative blot of 3 experiments. Columns represent the intensity of phospho-AKT ± SEM. One-way ANOVA followed by Dunnett’s multiple comparison test: *P < 0.05; **, P < 0.01; ***, P < 0.001

