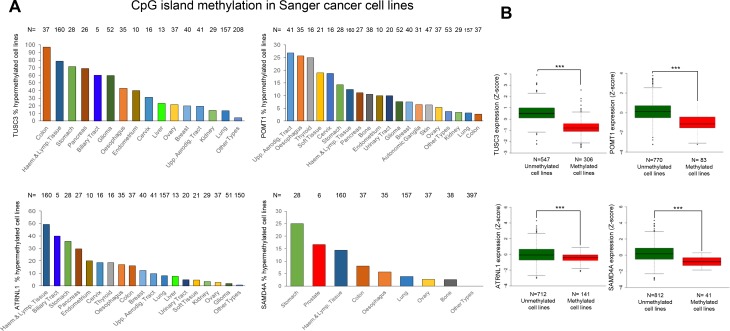
Figure 4. Hypermethylation profiles for the circRNA host genes in cancer cell lines and their association with transcript down-regulation.
(A) Percentage of TUSC3, ATRNL1, POMT1 and SAMD4A promoter CpG island hypermethylated samples in the Sanger panel of cancer cell lines by tumor type. “Haem.”, haematological; “Lymp”, lymphoid; “Aerodig.”, aerodigestive; “Upp.”, upper. (B) Promoter CpG island hypermethylation of the genes studied is significantly associated with downregulation of the corresponding transcript in the Sanger set of cancer cell lines. The box plots display the distribution of the expression values with the central solid line representing the median and the limits of the box, the upper and lower quartiles. The whiskers represent the minimum and maximum values excluding outliers (<1.5 × the interquartile range).

