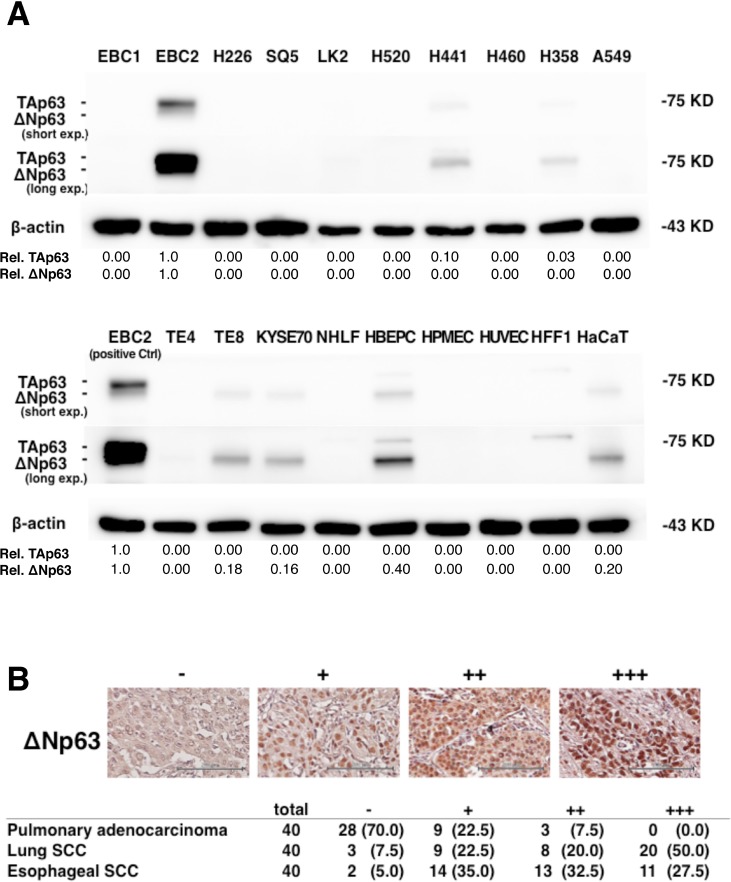
Figure 1. ΔNp63 expression in lung and esophageal SCC and pulmonary adenocarcinoma.
(A) Immunoblot analysis of TAp63 and ΔNp63 expression in the indicated cells. β-actin served as a control. A non-specific band with higher molecular weight than TAp63 (75 kDa) was seen in HBEPCs and HFF1s. Band densities normalized to the EBC2 cell band are shown below the blots. (B) Representative immunohistochemistry results. ΔNp63 staining intensity was scored as follows: none = −, weak = +, moderate = ++, and strong = +++ expression. Scale bars = 200 μm. Shown below are the frequencies of ΔNp63 expression in samples of primary pulmonary adenocarcinoma, lung SCC, and esophageal SCC. Percentages are given in parentheses.

