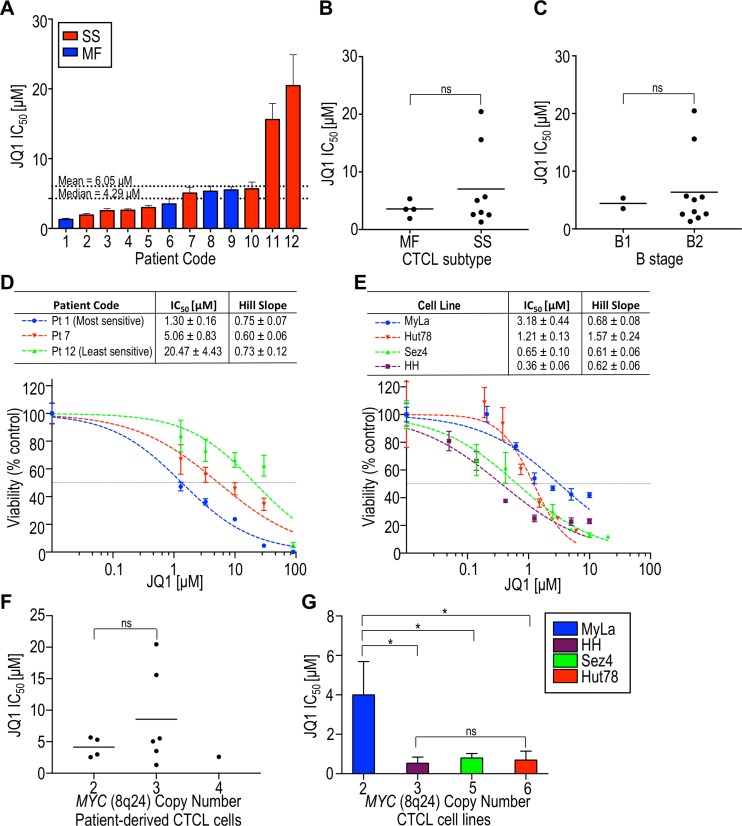
Figure 1. The BET inhibitor JQ1 substantially decreases the viability of patient-derived CTCL cells and CTCL cell lines.
All samples were incubated with JQ1 for 72 hours and dose-response curves were generated, from which IC50 and hill slopes were calculated. (A) IC50 of patient-derived samples in increasing order. The median and mean IC50s were 4.29 µM and 6.05 µM, respectively. Mycosis fungoides (MF) patients are in blue and Sézary syndrome (SS) patients are in red. (B) Comparison of IC50 with CTCL subtype at the time of diagnosis as either MF or SS. (C) Comparison of IC50 with CTCL B stage based on ISCL classification. (D) Representative dose-response curves for patient-derived samples. (E) Dose-response curves for cell lines. (F) Comparison of IC50 with MYC amplification status in patient-derived samples. (G) Comparison of IC50 with MYC amplification status in cell lines. ns, p > 0.05; pt, patient; *p < 0.05.

