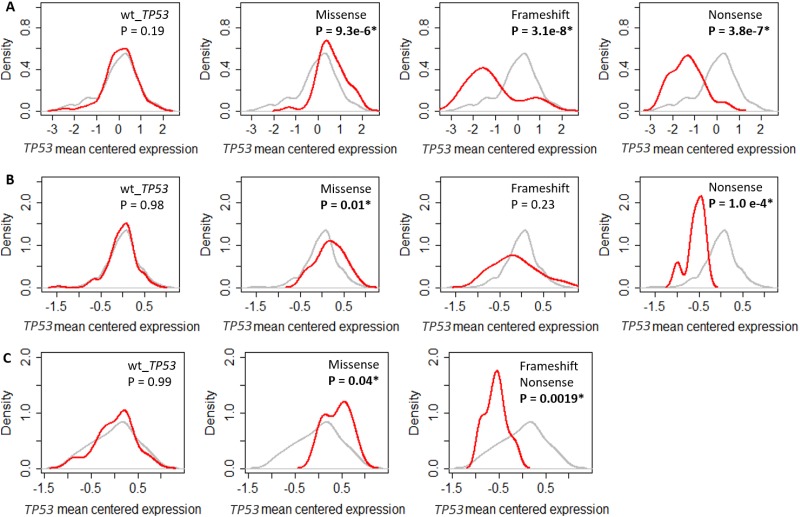
Figure 2. Impact of TP53 mutation on TP53 RNA expression in different breast cancer cohorts.
Density plots showing the levels of mean centered TP53 RNA levels in (A) TCGA. (B) GSE3494. (C) GSE61725. The grey line shows the density of the mean centered TP53 RNA levels of all the tumours in individual cohorts. The red line shows the density of the mean centered TP53 RNA levels in breast tumours with either wild type TP53 or missense, frameshift and nonsense mutations, in individual cohorts. Significant shift in the distributions of TP53 RNA levels if P < 0.05 determined using two-sided Kolmogorov-Smirnov test.

