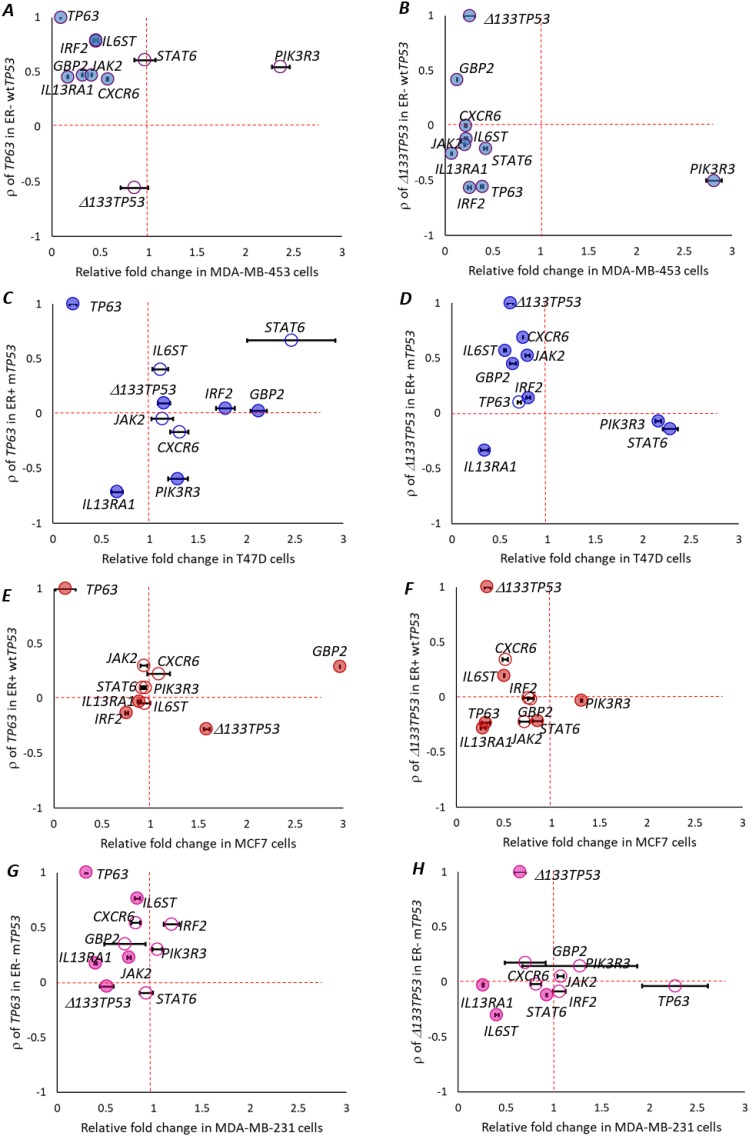
Figure 5. TP63 or Δ133TP53 regulates IFN-γ signalling in vitro.
Relative fold change in the expression of candidate IFN-γ signaling pathway genes, TP63 and Δ133TP53, 48h post treatment with siRNA targeting either TP63 or Δ133TP53 in (A-B) MDA-MB-453 cells that are ER- wtTP53. (C-D) T47D cells that are ER+ mTP53. (E-F) MCF7 cells that are ER+ wtTP53. (G-H) MDA-MB-231 cells that are ER- mTP53. A-H. (A) Relative fold change after si-TP63 treatment in MDA-MB-453 cells. (B) Relative fold change after si-Δ133TP53 treatment in MDA-MB-453 cells. (C) Relative fold change after si-TP63 treatment in T47D cells. (D) Relative fold change after si-Δ133TP53 treatment in T47D cells. (E) Relative fold change after si-TP63 treatment in MCF7 cells. (F) Relative fold change after si-Δ133TP53 treatment in MCF7 cells. (G) Relative fold change after si-TP63 treatment in MDA-MB-231 cells. (H) Relative fold change after si-Δ133TP53 treatment in MDA-MB-231 cells. (A-H) Association of RNA expression of candidate IFN-γ signaling pathway genes on the y-axis and relative fold change 72h post transfection on the x-axis. Genes with positive correlation are above the horizontal dotted line and those that are negatively correlated are below the horizontal dotted line. Genes that are upregulated relative to the si-Ctrl are to the right of the vertical dotted line and downregulated genes are to the left of the vertical dotted line. Genes that are changed significantly are represented with filled colored circles, ● = significant, ○ = not significant (student’s t-test, p < 0.05). Levels were measured in three biological replicates for each treatment.

