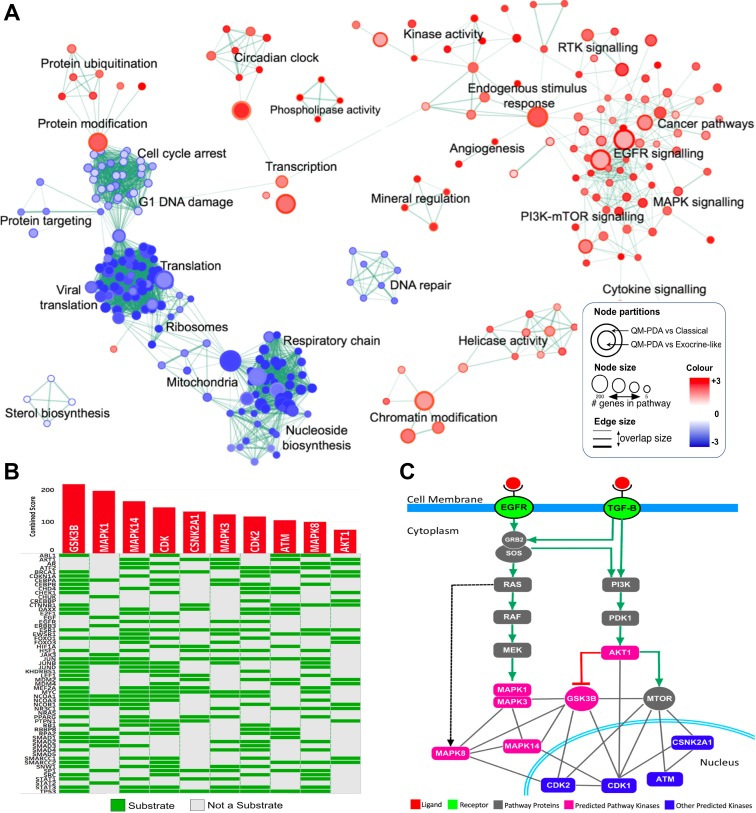
Figure 2.
(A) Enrichment Map of QM-PDAC vs C-PDAC and EL-PDAC tumours: GSEA was used to obtain enriched gene ontology (GO)-terms that were visualised using the Enrichment Map plug-in for Cytoscape. Each node represents a GO-term with similar nodes clustered together and connected by edges with the number of known interactors between the nodes being represented by the thickness of edges. The size of each node denotes the gene set size for each specific node GO-term. A map comparing C-PDAC and EL-PDAC tumours is shown in Supplementary Figure 2. (B) Expression2Kinases solution: Heat map showing the top ten predicted kinases ranked according to their combined statistical score based on the number of substrates they phosphorylate within a protein-protein interaction subnetwork. Along the rows of the heatmap are proteins which are the substrates for kinases given along the columns of the heatmap. (C) Mapping of the top ten predicted kinases onto simplified models of the EGFR and TGF-Β signaling pathways. Six of the top ten ranked kinases (pink nodes) fall within these two pathways whereas the other predicted proteins are involved either directly in the cell cycle, or in the regulation of the cell cycle (blue nodes). We have provided simplified EGFR and TGF-β pathways with mapped mRNA expression levels in Supplementary Figure 5B.

