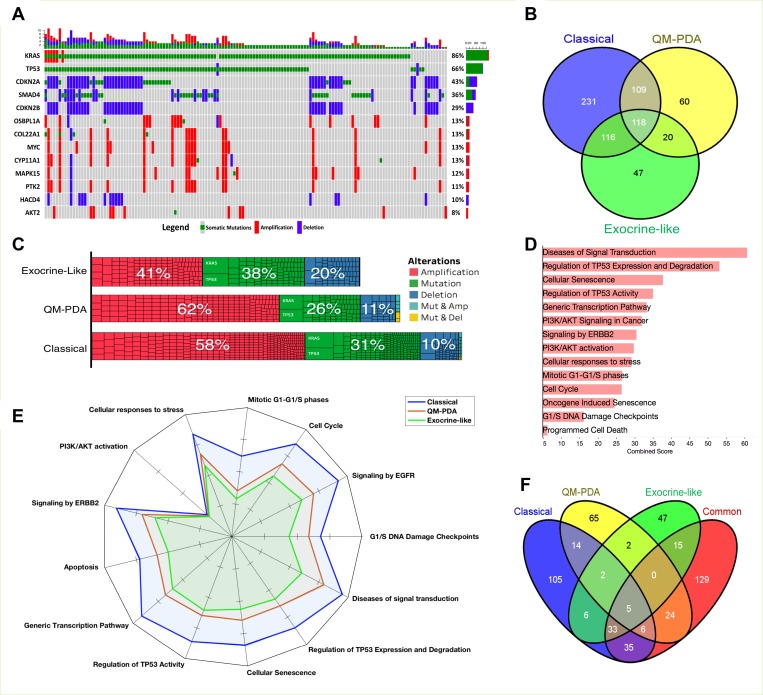
Figure 4. Mutation and gene copy number analyses.
(A) Genes with the most alterations in PDAC tumours. The only genetic alterations considered are mutations in, and amplifications of known oncogenes, and mutations in, and deletions of, known tumour suppressor genes. (B) The distribution of alterations among the three PDAC subtypes. Refer to Supplementary File 5 for details concerning alterations in each set. (C) The extent of genomic alterations expressed as a percentage of total numbers of alterations found within the tumours of each PDAC subtype. Each cell in the bar-grid represents a mutant gene. (D) Reactome pathway enrichment results of the 118 genes that are commonly altered in tumour cells of all three PDAC subtypes. Refer to Supplementary File 6 for the complete list of Reactome pathways that represent significantly enriched genetic alterations in the different PDAC subtypes. (E) The predicted extent of mutation-induced pathway dysregulation for the different PDAC subtypes. (F) The distribution of mutation-induced pathway dysregulations for mutations specifically associated with particular PDAC subtypes and common pathway enrichment. The non-overlapping pathways are those disrupted only in single PDAC subtypes (see Supplementary File 6).

