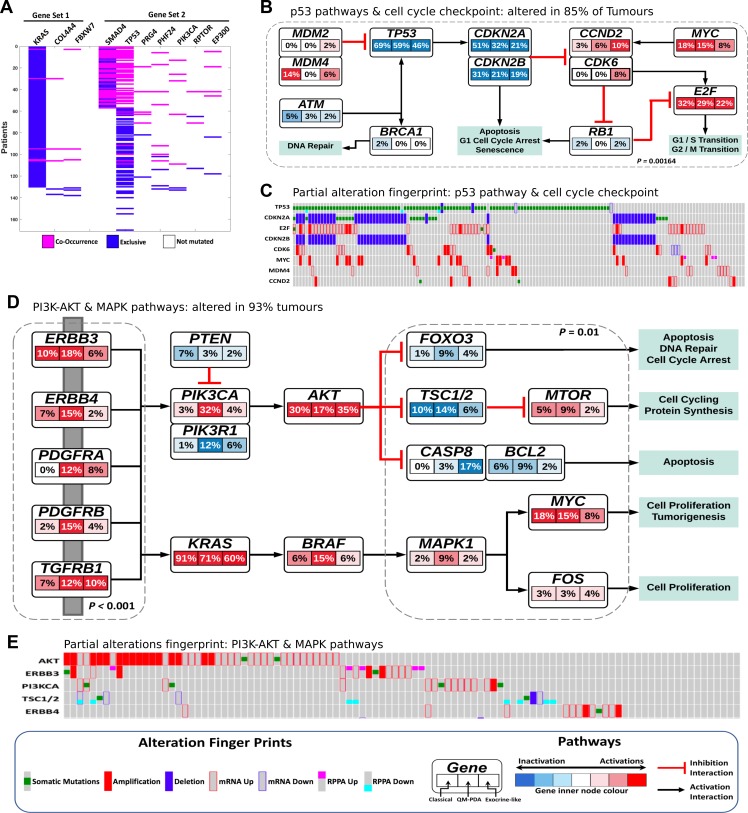
Figure 5.
(A) The two co-occurring pathways in PDAC that are predicted to drive oncogenesis based on the mutational landscape representing two common driver pathways. (B) Alterations in p53 and cell cycle checkpoint pathways. p-value = C-PDAC vs Other subtypes, calculated using Fisher's exact test. Red indicates activating genetic alterations whereas blue indicates inactivating alterations. Darker shades correspond to higher alteration frequencies. Each node within the pathway represent a gene and the highlighted segments within each node and the percentage representing the alteration in the three PDAC subtype: C-PDAC, QM-PDAC and EL-PDAC from left, centre, and right, respectively. (C) The pattern of genetic alteration in selected genes that encode proteins involved in the p53 and cell cycle checkpoint pathways. (D) Alterations in the MAPK, RTKs and PI3K signaling pathways. p-values = QM-PDAC vs Other subtypes, calculated using Fisher's exact test. The connectivity of network components was extracted from Reactome Pathways, BioGrid and the literature. (E) The pattern of genetic alterations in selected genes that encode components of the MAPK and PI3K-mTOR pathways.

