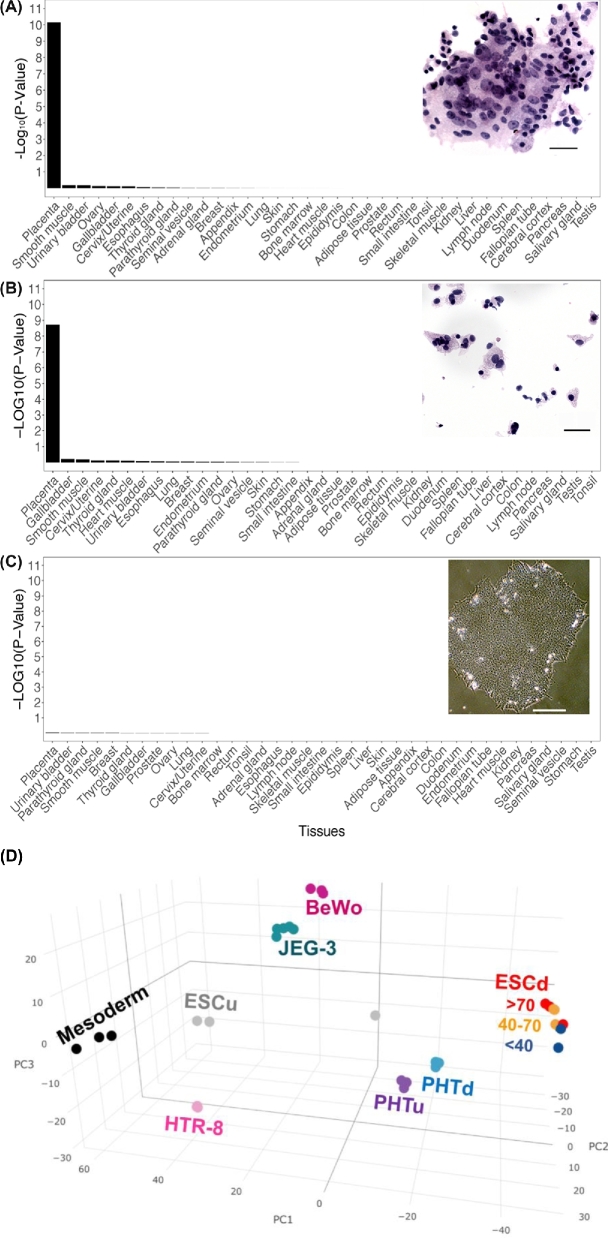
Figure 5.
The distinctive trophoblastic signature of the ESC-derived TB. Data were derived from RNAseq results of Yabe et al. [80] on cell populations fractionated by size from colonies of ESC. Enrichment of placenta-specific genes in the stem cell derived STB (ESCd > 70) (A), cytoTB (ESCd < 40) (B), and undifferentiated ESC (ESCu) (C). The respective images are clumped sheets of isolated STB, cytoTB (ESCd < 40), and ESC colonies, respectively. In A and B, cells were isolated from ESCd after 8 days of differentiation [80] and stained by hematoxylin and eosin. The enrichments are presented as –Log10(P-value). The bars for the images are 20, 20, and 100 μm, respectively. (D) PCA plot based on the 1000 most highly expressed genes in STB (>70 μm; red), in ESCd cells of intermediate size (40–70 μm; yellow), in the predominant mononuclear cells (<40 μm; blue), and in undifferentiated ESC (gray). The ESCd cell fractions are compared with the transformed cell lines (BeWo, HTR-8, and JEG-3), mononucleated cytoTB and STB (PHTu and PHTd) from term placentas, and mesoderm cells also generated from ESC. More detailed procedures and original figures are provided by Jain et al. [81].

