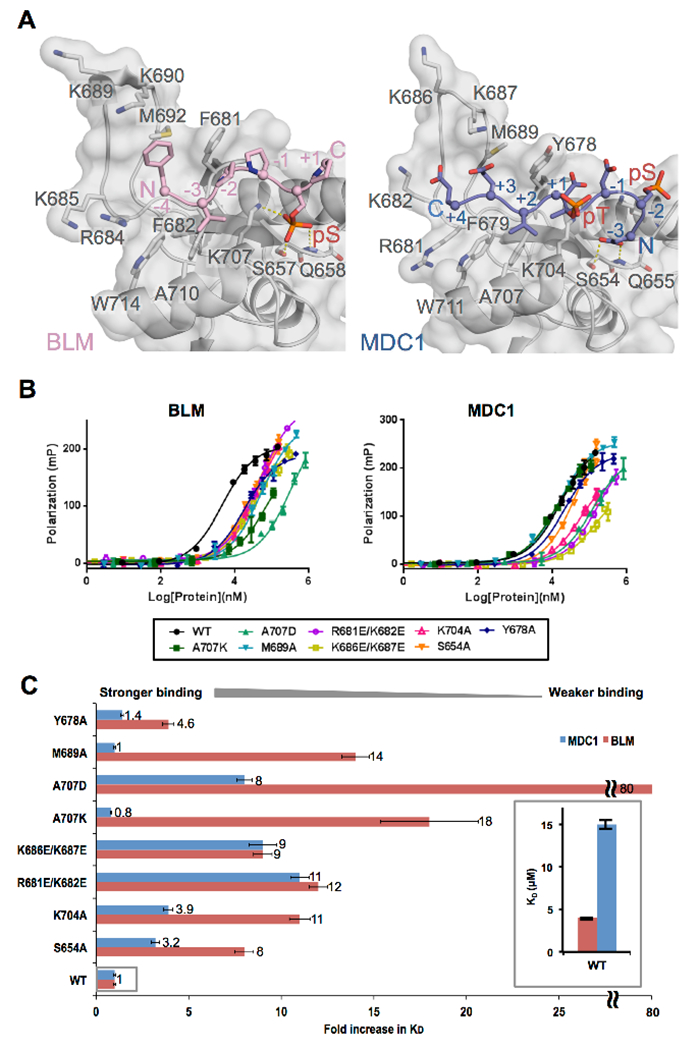
Figure 2. Comparison of TopBP1 recognition of BLM and MDC1.

A. Structural comparison of TopBP1-BLM and TopBP1-MDC1 complexes. Mouse TopBP1-BLM complex (left) and human TopBP1-MDC1 (right) are aligned by their BRCT5 main-chain Cα positions. Both TopBP1 BRCT structures are displayed with semi-transparent surface over a grey cartoon, while the BLM peptide is displayed as a pink cartoon and the MDC1 peptide is displayed as a blue cartoon. Key interacting residues are displayed as sticks and hydrogen bonds are indicated by yellow dash-lines. Note that the region in mouse TopBP1 N-terminal to BRCT4/5 is three residues larger than the human protein. As a result, the numbers for homologous residues are three larger for mouse compared to human.
B. Comparison of the binding affinities of BLM and MDC1 phosphopeptides for a panel of human TopBP1 BRCT5 variants using FP. WT TopBP1 BRCT5 as well as a panel of eight missense variants were titrated against either BLM phosphopeptide (left) or the MDC1 phosphopeptide (right) and their binding affinities were assessed by FP.
C. Effects of human TopBP1 BRCT5 missense mutations on the binding of either MDC1 or BLM. The fold increase in KD is plotted for each BRCT5 variant normalized against the binding affinity for the WT. Results for BRCT5-MDC1 interactions are shown in blue, while the results for BRCT5-BLM interactions are shown in pink. The inset shows the relative difference in KD between WT BRCT5-MDC1 and WT BRCT5-BLM.
