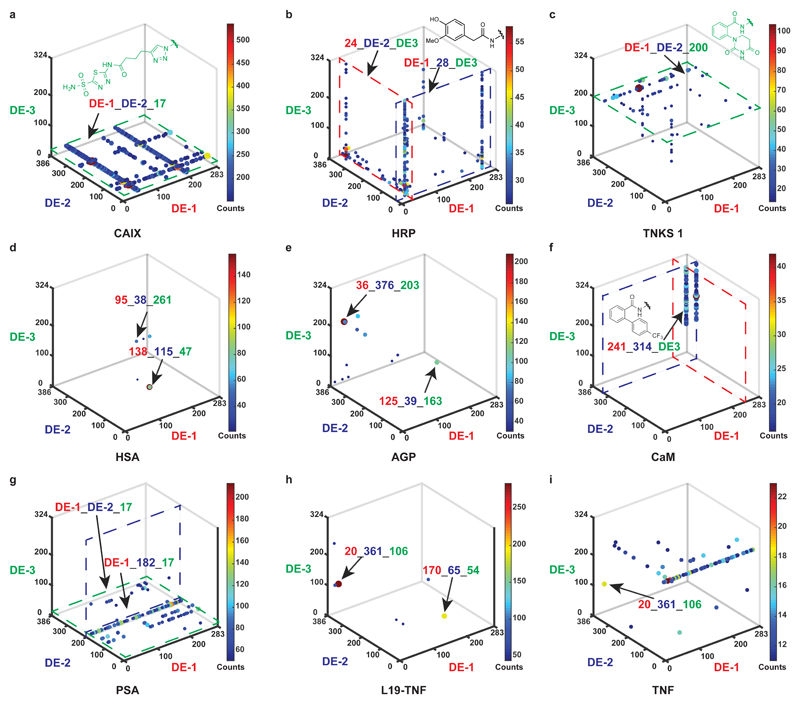
Figure 2. Selection fingerprints from the multiple display DNA-encoded chemical library.
a, High-throughput DNA sequencing (HTDS) plot of a selection against CAIX. The x-, y- and z-axes represent the first diversity element (DE-1, red), second diversity element (DE-2, dark blue), and third diversity element (DE-3, green) of the library, respectively. Jet colour scale and dot size represent the HTDS sequence counts. Total sequence counts (TSC) = 2,357,282, cut-off level = 150. b, HTDS plot of a selection against HRP. TSC = 4,269,414, cut-off level = 25. c, HTDS plot of a selection against TNKS 1. TSC = 2,525,256, cut-off level = 10. d, HTDS plot of a selection against HSA. TSC = 3,344,294, cut-off level = 20. e, HTDS plot of a selection against AGP. TSC = 1,929,066, cut-off level = 30. f, HTDS plot of a selection against CaM. TSC = 1,931,086, cut-off level = 15. g, HTDS plot of a selection against PSA. TSC = 2,244,812, cut-off level = 50. h, HTDS plot of a selection against L19-TNF. TSC = 2,353,006, cut-off level = 40. i, HTDS plot of a selection against TNF. TSC = 2,357,282, cut-off level = 10.

